Leverage the Google Analytics APIs: using R
Loves Data
At Loves Data, our specialist teams all have their particular favourite tools (and sometimes, they’re not Google-based!). Johann de Boer, our Digital Analytics Manager, is a fan-boy for all things R, a free, open-source statistical programming language. So much so, that he’s developed an open source R package, ‘ganalytics’ that lets you integrate your Google Analytics data with other R packages.
Working with data outside of Google Analytics
Google Analytics is constantly evolving with new ways to collect, report and analyse data about your online business. Although the easy to use web interface meets the daily needs of most users, there are times where you might need to work with data from other sources, or use other tools, to analyse or present business or customer insights.
Google Analytics lets you import data by uploading CSV files (compatible with spreadsheet applications) as well as export data from most reports in a range of file formats. These are powerful and easily accessible features, but there are some limitations to them, and if you’re using these repeatedly, you’ll soon see the need for automation.
This is where another set of Google Analytics features come in, Google Analytics APIs, which allow you to directly connect to Google Analytics from other applications. There are many existing applications that use these APIs, both to get data into, and out of, Google Analytics, as well as for getting or setting configurations for your containers, accounts, properties, views, and user assets. The most obvious example is your website – whenever someone visits your website, the tracking code which you installed sends data to Google Analytics using the Measurement Protocol.
To get data out of Google Analytics, there are the Reporting APIs. Many applications use these, such as the many Google Analytics plugins available for Google Spreadsheets, and presumably the Google Analytics app for iOS and Android too. These tools extend Google Analytics to offer you more ways to work with your Google Analytics data.

What is this thing called R?
R is another way that you can get more insight from your Google Analytics data. Essentially, R is a language, and environment, for statistical computing and graphics. As a free and open-source language, R is gaining popularity as the industry-standard computing language for statistics and data science worldwide. It is commonly used in teaching students statistics and data analysis, and many big companies have adopted and contributed to R as well (including Google and Microsoft).
R is designed for working with data and has a large and growing worldwide community of developers who build packages for R to serve the wide range of user needs. There are tens of thousands of packages available for R ranging from publication quality data visualisation, interactive online dashboards, and even packages for connecting R to Google Analytics.
Introducing: ‘ganalytics’
Our own Johann de Boer has developed an open source R package, named ‘ganalytics’, which allows R users to get data from Google Analytics directly (as well as data from outside of Google Analytics if needed) and use that data with other R packages to analyse and present this in meaningful and creative ways.
Because R is a programming language designed for working with statistical data like that from Google Analytics, any analysis that is performed can be easily repeated and re-used again (and again). So as you undertake your analysis, you can keep track of each step you make along the way. This is really helpful if you realise at some point during your analysis that you made a mistake, as you can go back and change the necessary step in your script and then re-run it within a matter of minutes or seconds.
To show you what a script looks like, here’s a basic example of an analysis performed in R using the ganalytics package:
- library(ganalytics)
- query <- GaQuery(view = 98765432)
- DateRange(query) <- c("2015-01-01", "2015-01-31")
- Metrics(query) <- "sessions"
- Dimensions(query) <- "date"
- data <- GetGaData(query)
- with(data, plot(date, sessions, type = "l", ylim = c(0, max(sessions))))
Here’s what the output looks like:
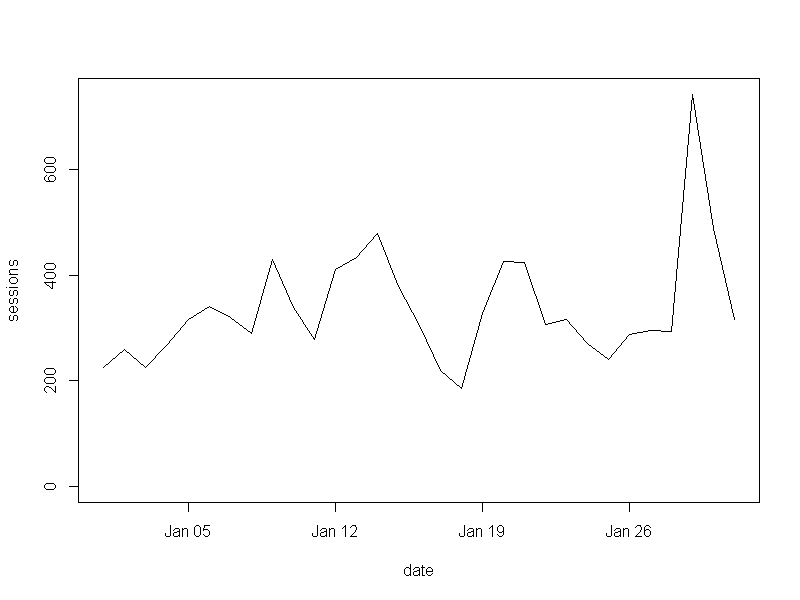
You might have guessed what the above code does, but let’s go through it together line by line:
- Start the ganalytics package
- Select the Google Analytics view with ID of '98765432'
- Select the date range 1 to 31 January 2015
- Choose a metric: number of sessions
- Choose a dimension: by date
- Get the data
- Plot sessions by date as a line chart, setting the vertical axis to start at zero
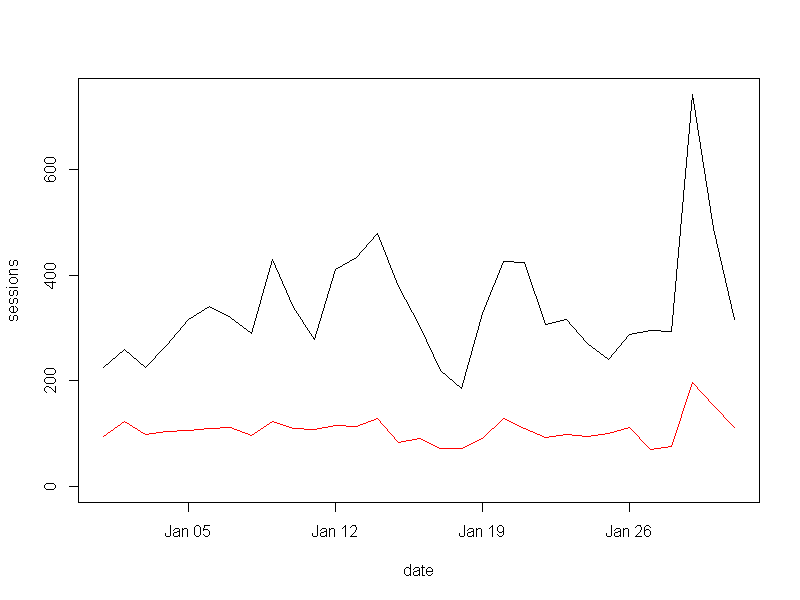
As you can see, the script captures each of the steps needed to produce the visualisation. Think of the script as a recipe which can be re-used or modified. For example, you could add another three steps to the script to overlay a segment (e.g. mobile traffic) on the chart:
- Segment(query) <- Expr("deviceCategory", "==", "mobile")
- data <- GetGaData(query)
- lines(x = data$date, y = data$sessions, col = "red")
This produces the following output:
Just as you would create your own custom reports, dashboards and segments in Google Analytics, you can build up a library of R scripts for the various types of reports you want to produce, or analyses you need to perform.
Learning to use R can be challenging (and addictive). Most practitioners recommend learning by example – so give it a try! Visit the ganalytics site for instructions on installing the ganalytics package, and examples of other scripts. Let us know how you go, and what you think, in the comments.