Solving Reporting Gaps with Calculated Metrics in Google Analytics 4
Benjamin Mangold
Google Analytics gives you valuable insights into how people interact with your website. But sometimes, the standard reports don’t tell you everything you need to know. That’s where calculated metrics come in. They allow you to go beyond the basics – helping you create your own metrics that reflect what really matters to your business.
Think of calculated metrics as recipes – you're combining ingredients (your existing metrics) into something new that better suits your taste. These custom metrics can help fill in the gaps, highlight trends, and support smarter decision-making.
What Are Calculated Metrics?
Calculated metrics in Google Analytics 4 (GA4) are custom formulas you define using existing metrics or event parameters. These formulas let you create tailored insights to answer business-specific questions that default metrics can't.
For example, you could create a calculated metric to:
- Show profit margins by factoring in costs
- Compare conversion rates across device categories
- Calculate the percentage of returning users
These metrics aren’t available out of the box – but by creating them, you can gain deeper insights and customize your reporting based on your goals.
Good to know: Standard GA4 properties can include up to 5 calculated metrics. GA4 360 properties allow up to 50.
Identifying Reporting Gaps
The first step to using calculated metrics effectively is identifying gaps in your reporting. Here are some common scenarios:
- Missing context: You're seeing high traffic from a campaign, but no increase in conversions.
- Complex user journeys: You want to measure engagement or conversion over a sequence of actions not reflected in default reports.
- Business-specific KPIs: You need to track performance indicators unique to your industry or organization.
Calculated metrics help bridge these gaps by letting you define what success looks like for your goals – and how to measure it.
When to Use Calculated Metrics
Calculated metrics are ideal when you want to:
- Combine multiple metrics into one meaningful number
- Create ratios, averages, or percentages that aren’t available by default
- Tailor insights to your business model or industry
Practical examples include:
- Revenue Per Active User =
Purchase Revenue / Active Users - Engaged Conversion Rate =
Key Events / Engaged Sessions - Article Completion Rate =
Scrolled Users / Views
How to Create a Calculated Metric in GA4
To create a calculated metric in GA4, follow these steps:
- Navigate to 'Admin'.
- In the property column, click 'Calculated metrics' under 'Data display'.
- Click 'Create Calculated Metric'.
- Enter a metric name – something descriptive like 'Revenue Per Session'.
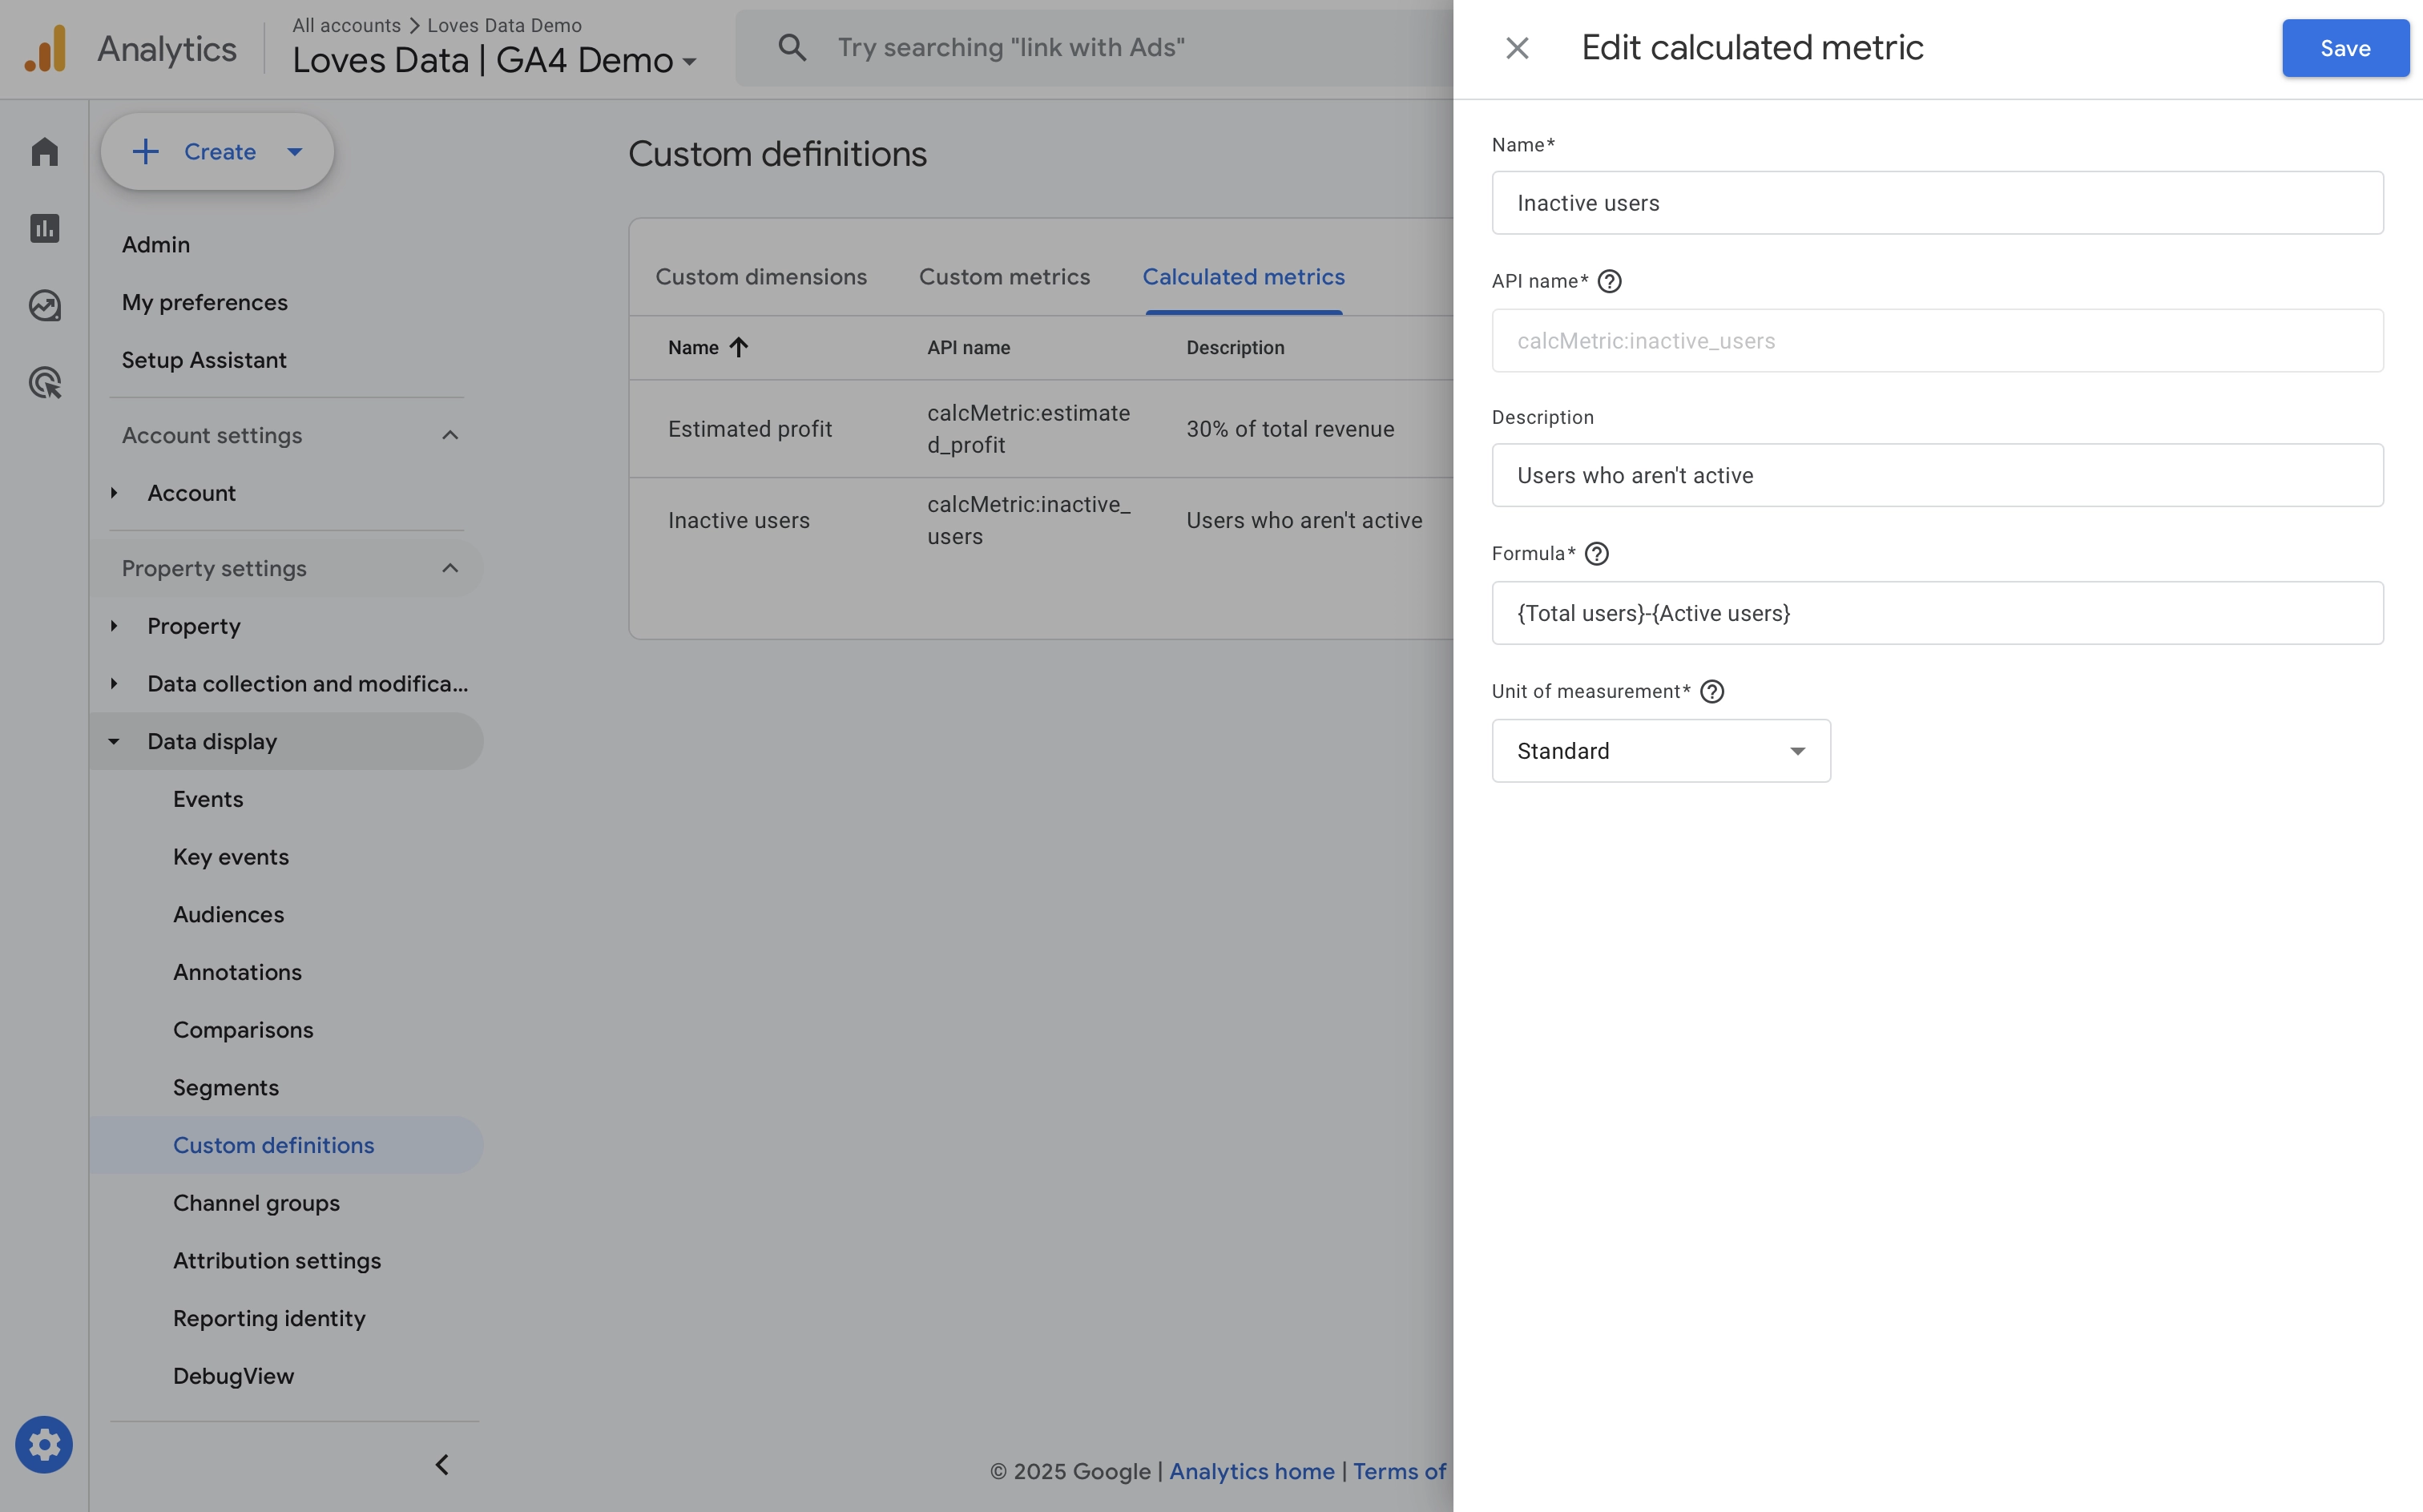
- Configure your metric:
- API Name: This is used programmatically and auto-generated from your name, but you can customize it.
- Description: Add a short summary to explain the purpose of the metric for your team or future reference.
- Formula: This is where the metric is defined. You can reference standard metrics (like
Purchase RevenueorSessions) or existing event parameters. - Unit of Measurement: Choose from:
- Standard: For ratios, percentages, or counts
- Currency: For revenue-based metrics
- Distance: Useful if you're collecting location or physical activity data
- Time: For metrics like average engagement duration
- Click 'Save'.
Best Practices for Creating Calculated Metrics
- Start with clear business questions: Create metrics that align with your goals.
- Keep formulas simple: This makes testing and validation easier.
- Use descriptive names: Help others (and future you) understand what the metric measures.
- Test your metrics: Validate against known data points or smaller data sets.
- Document them: Keep track of why and how each metric was created.
- Review regularly: Adjust or remove metrics that are no longer relevant.
Real-World Examples
Ecommerce: Profit Margin per Product Category
Question: Which product categories generate the most profit, not just revenue?
Revenue alone doesn’t tell the whole story – some high-revenue categories may have low margins. If you’ve imported product cost data (for example, using custom parameters or data import), you can calculate profit margin.
Formula: (Item Revenue - Item Cost) / Item Revenue
Unit: Standard (displayed in decimal form)
This gives you a profit margin ratio – for example, 0.25 means a 25% margin.
Content Website: Article Completion Rate
Question: What percentage of readers complete an article?
You can use the default 'Scrolled Users' metric to calculate when people complete viewing a particular page on your website.
Formula: Scrolled Users / Views
Unit: Standard (displayed in decimal form)
This metric helps identify which articles hold attention and which ones lose readers partway through.
Marketing Campaigns: Cost per Engaged Session
Question: Are your ad campaigns driving meaningful engagement?
If you're importing cost data into GA4 and measuring engagement using the standard 'Engaged Sessions' metric:
Formula: Ads Cost / Engaged Sessions
Unit: Currency
This helps compare the efficiency of your campaigns, especially when evaluating beyond clicks or impressions.
Lead Gen Website: Form Completion Rate
Question: What percentage of users who start your form actually submit it?
If you create custom event-scoped metrics in GA4 that count how many times the form_start and form_submit events occur, you can use those in a calculated metric to track form completion rate.
Formula: Form Submit / Form Start
Unit: Standard (displayed in decimal form)
This metric tells you how effective your form is at converting interest into action.
Tip: If you haven’t configured the form events as custom metrics, you can still calculate form completion rate using event name filters in an Exploration report.
Take Your Analytics Further
Calculated metrics are a powerful way to close reporting gaps and gain custom insights that help you make smarter decisions. Whether you’re improving a marketing strategy or evaluating content engagement, these metrics give you the flexibility to tailor reports to your needs.
Want to deepen your skills and make the most of Google Analytics 4? Check out our GA4 Course where you'll learn even more about metrics, how to build custom reports, and unlock the full potential of GA4.