GA4 Demo Account: How to Access the Google Analytics Demo
Loves Data
Diving into Google Analytics for the first time or after a break can feel overwhelming. To make the process easier, Google provides a free Google Analytics demo account that anyone can access. Whether you're a marketer, analyst, or business owner, the GA4 demo account lets you explore real data from a live ecommerce store without having to set up tracking on your own website.
In this post, you’ll learn how to access and make the most of the Google Analytics demo, including key features and tips to help you understand the platform more effectively. You can also check out our GA4 demo account tutorial for a visual walkthrough.
How to Access the Google Analytics Demo Account
To start exploring the GA4 demo account, follow these simple steps:
- Navigate to the GA4 Demo Account
Visit the Google Analytics Demo Website Reports or access the demo App Reports if you’re interested in mobile app data. - Sign in to Your Google Account
You’ll need a Google account to access the Google Analytics demo account. If you don’t have one, you can create a free account. - Accept the Terms and Conditions
If this is your first time using Google Analytics, you may need to accept the terms and conditions before proceeding. - Start Exploring
Once signed in, you’ll be redirected to the Google Analytics demo interface, where you can start viewing real business data and reports.
Why Use Google’s GA4 Demo Account?
The GA4 demo account is a nearly full-featured Google Analytics 4 property with real-time data from the Google Merchandise Store—an actual eCommerce site selling Google-branded products.
Here’s what makes it so valuable:
- No need to install tracking code or own a website
- Learn how to navigate the Google Analytics demo interface
- Access standard reports, use comparisons, and build custom explorations
- Practice working with real-world analytics data to make more informed decisions
What You Can Learn from the Google Analytics Demo Account
1. Acquisition Reports
These reports show how users find the website. The GA4 demo account shows you:
- Traffic sources such as Organic Search, Paid Search, Organic Social, Paid Social, Referrals, and more
- Campaign performance insights for tagged inbound marketing
- Compare marketing channels and drill-down for additional insights
Here we can see the Acquisition Overview report showing the number of Active Users and the top ways people are finding the website:
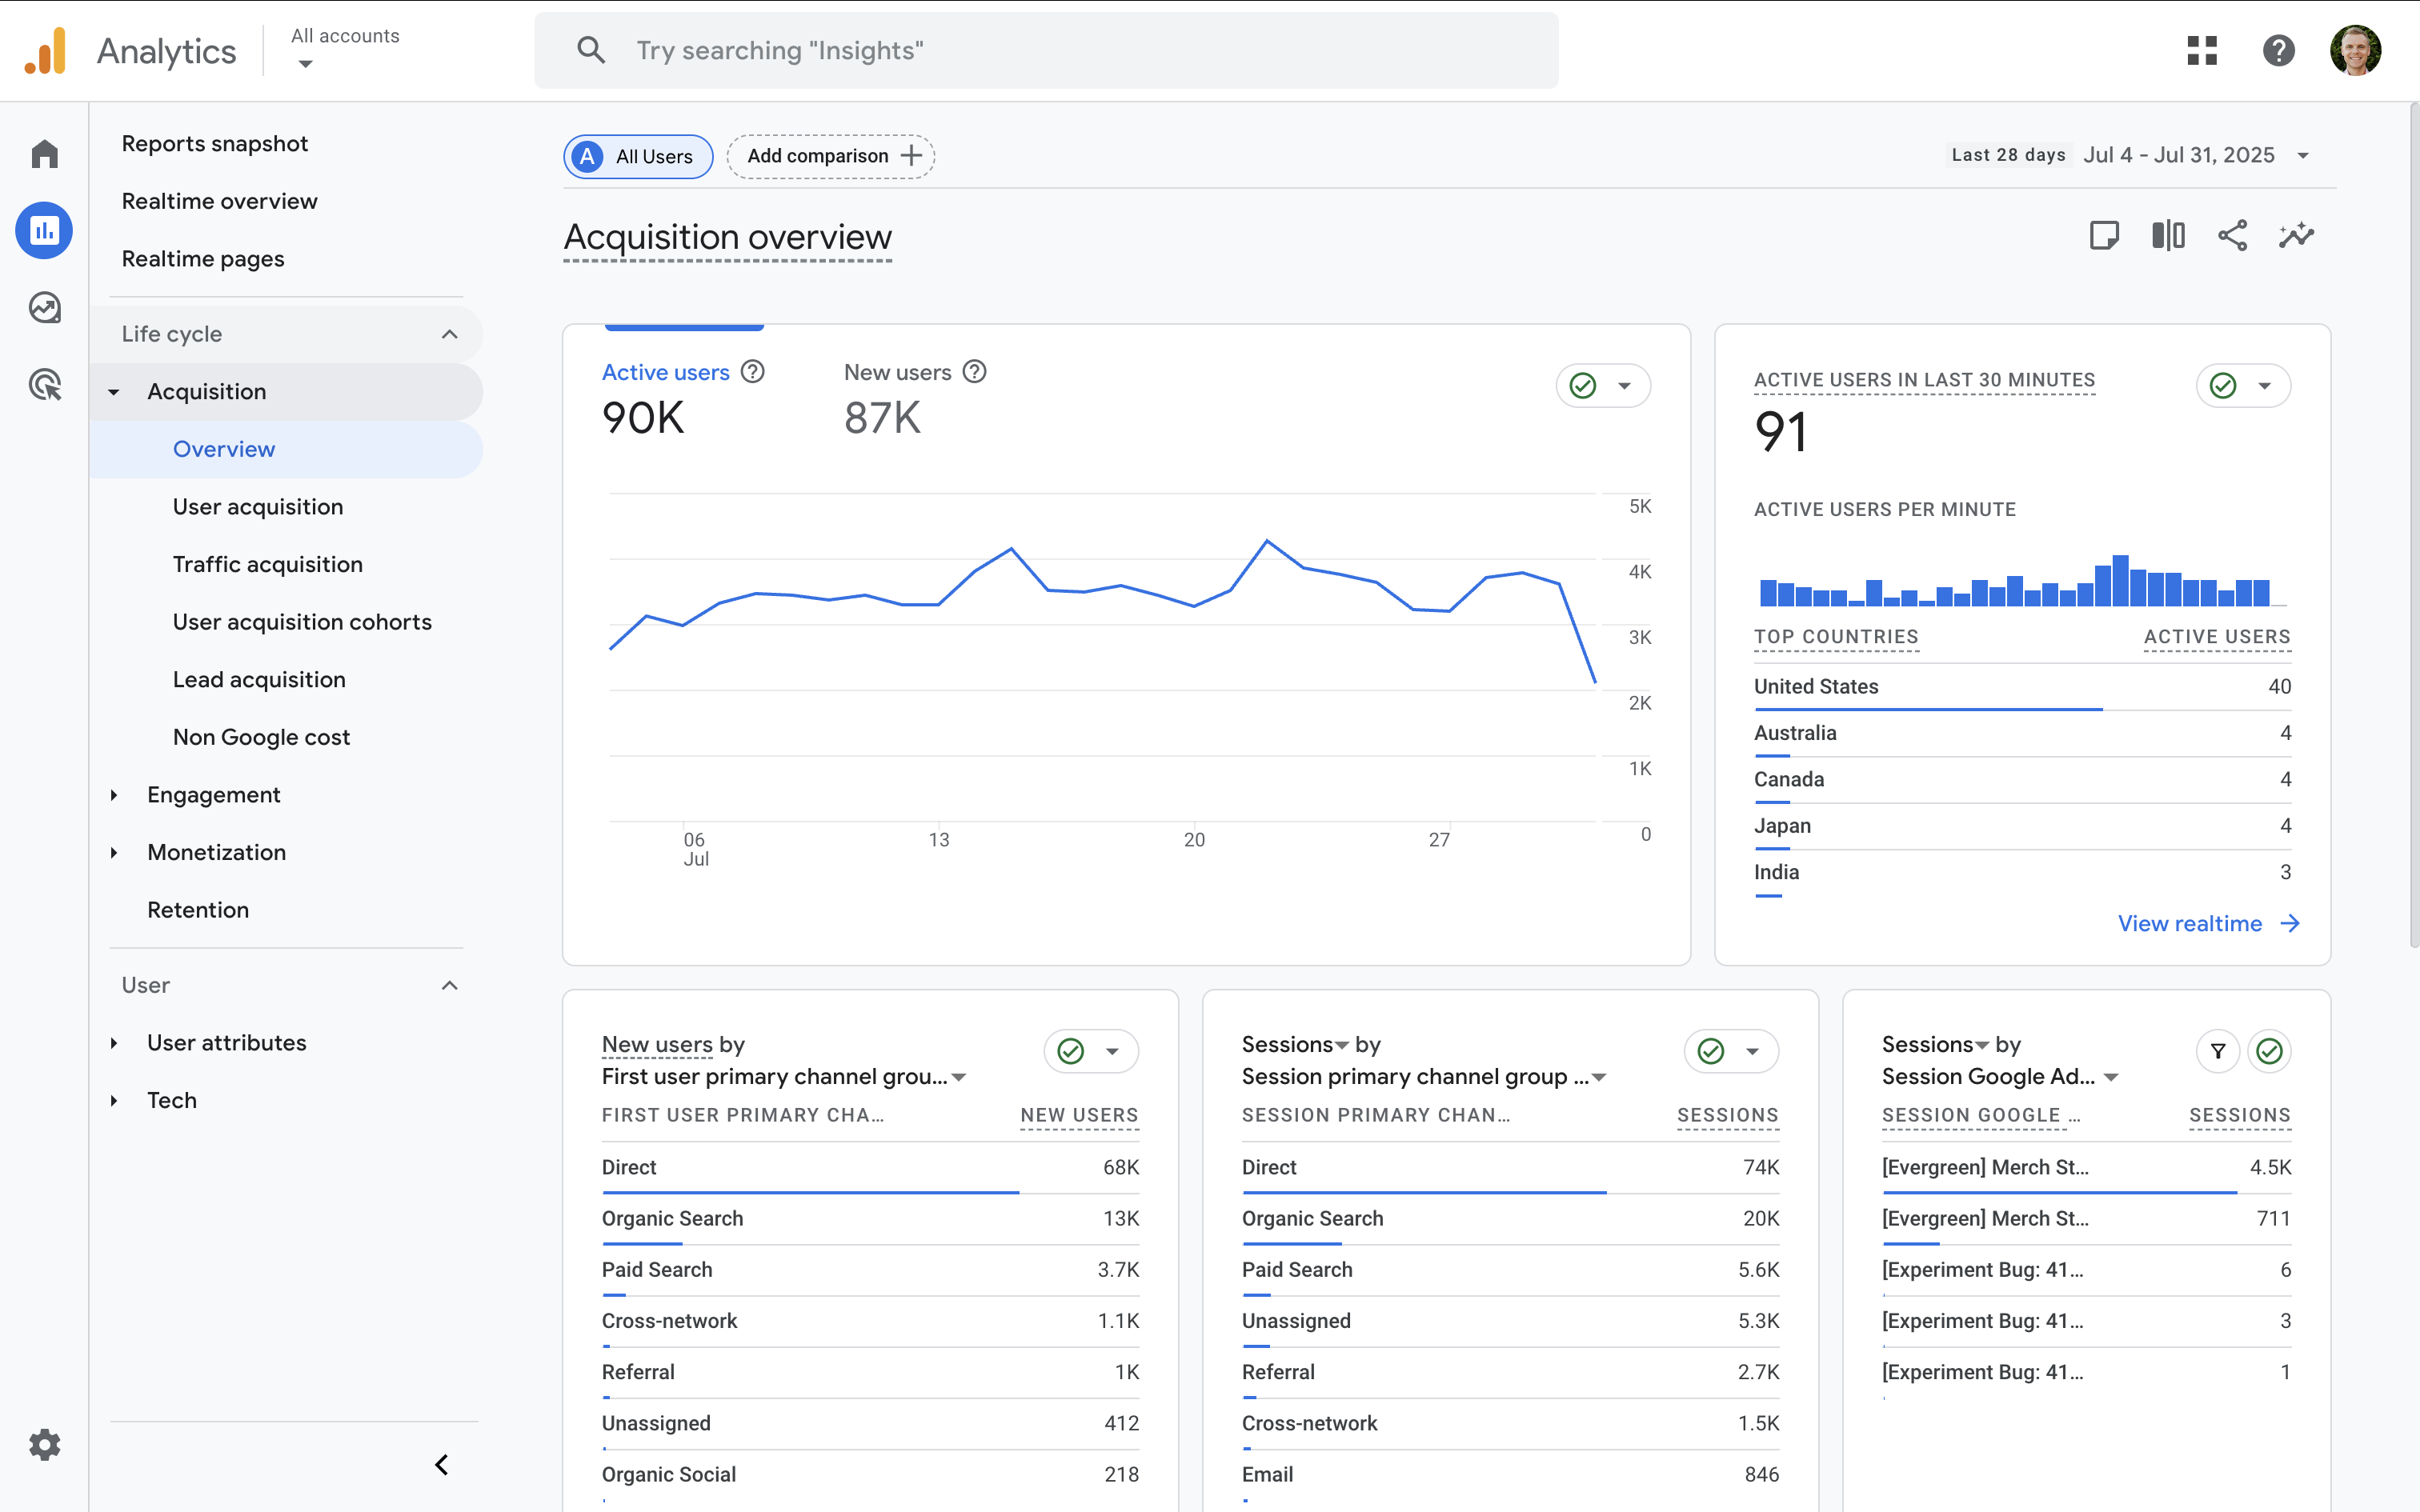
Tip: The 'User Acquisition' report shows you how new users first found your website, while the 'Traffic Acquisition' report shows you how people found your website to start each of their sessions.
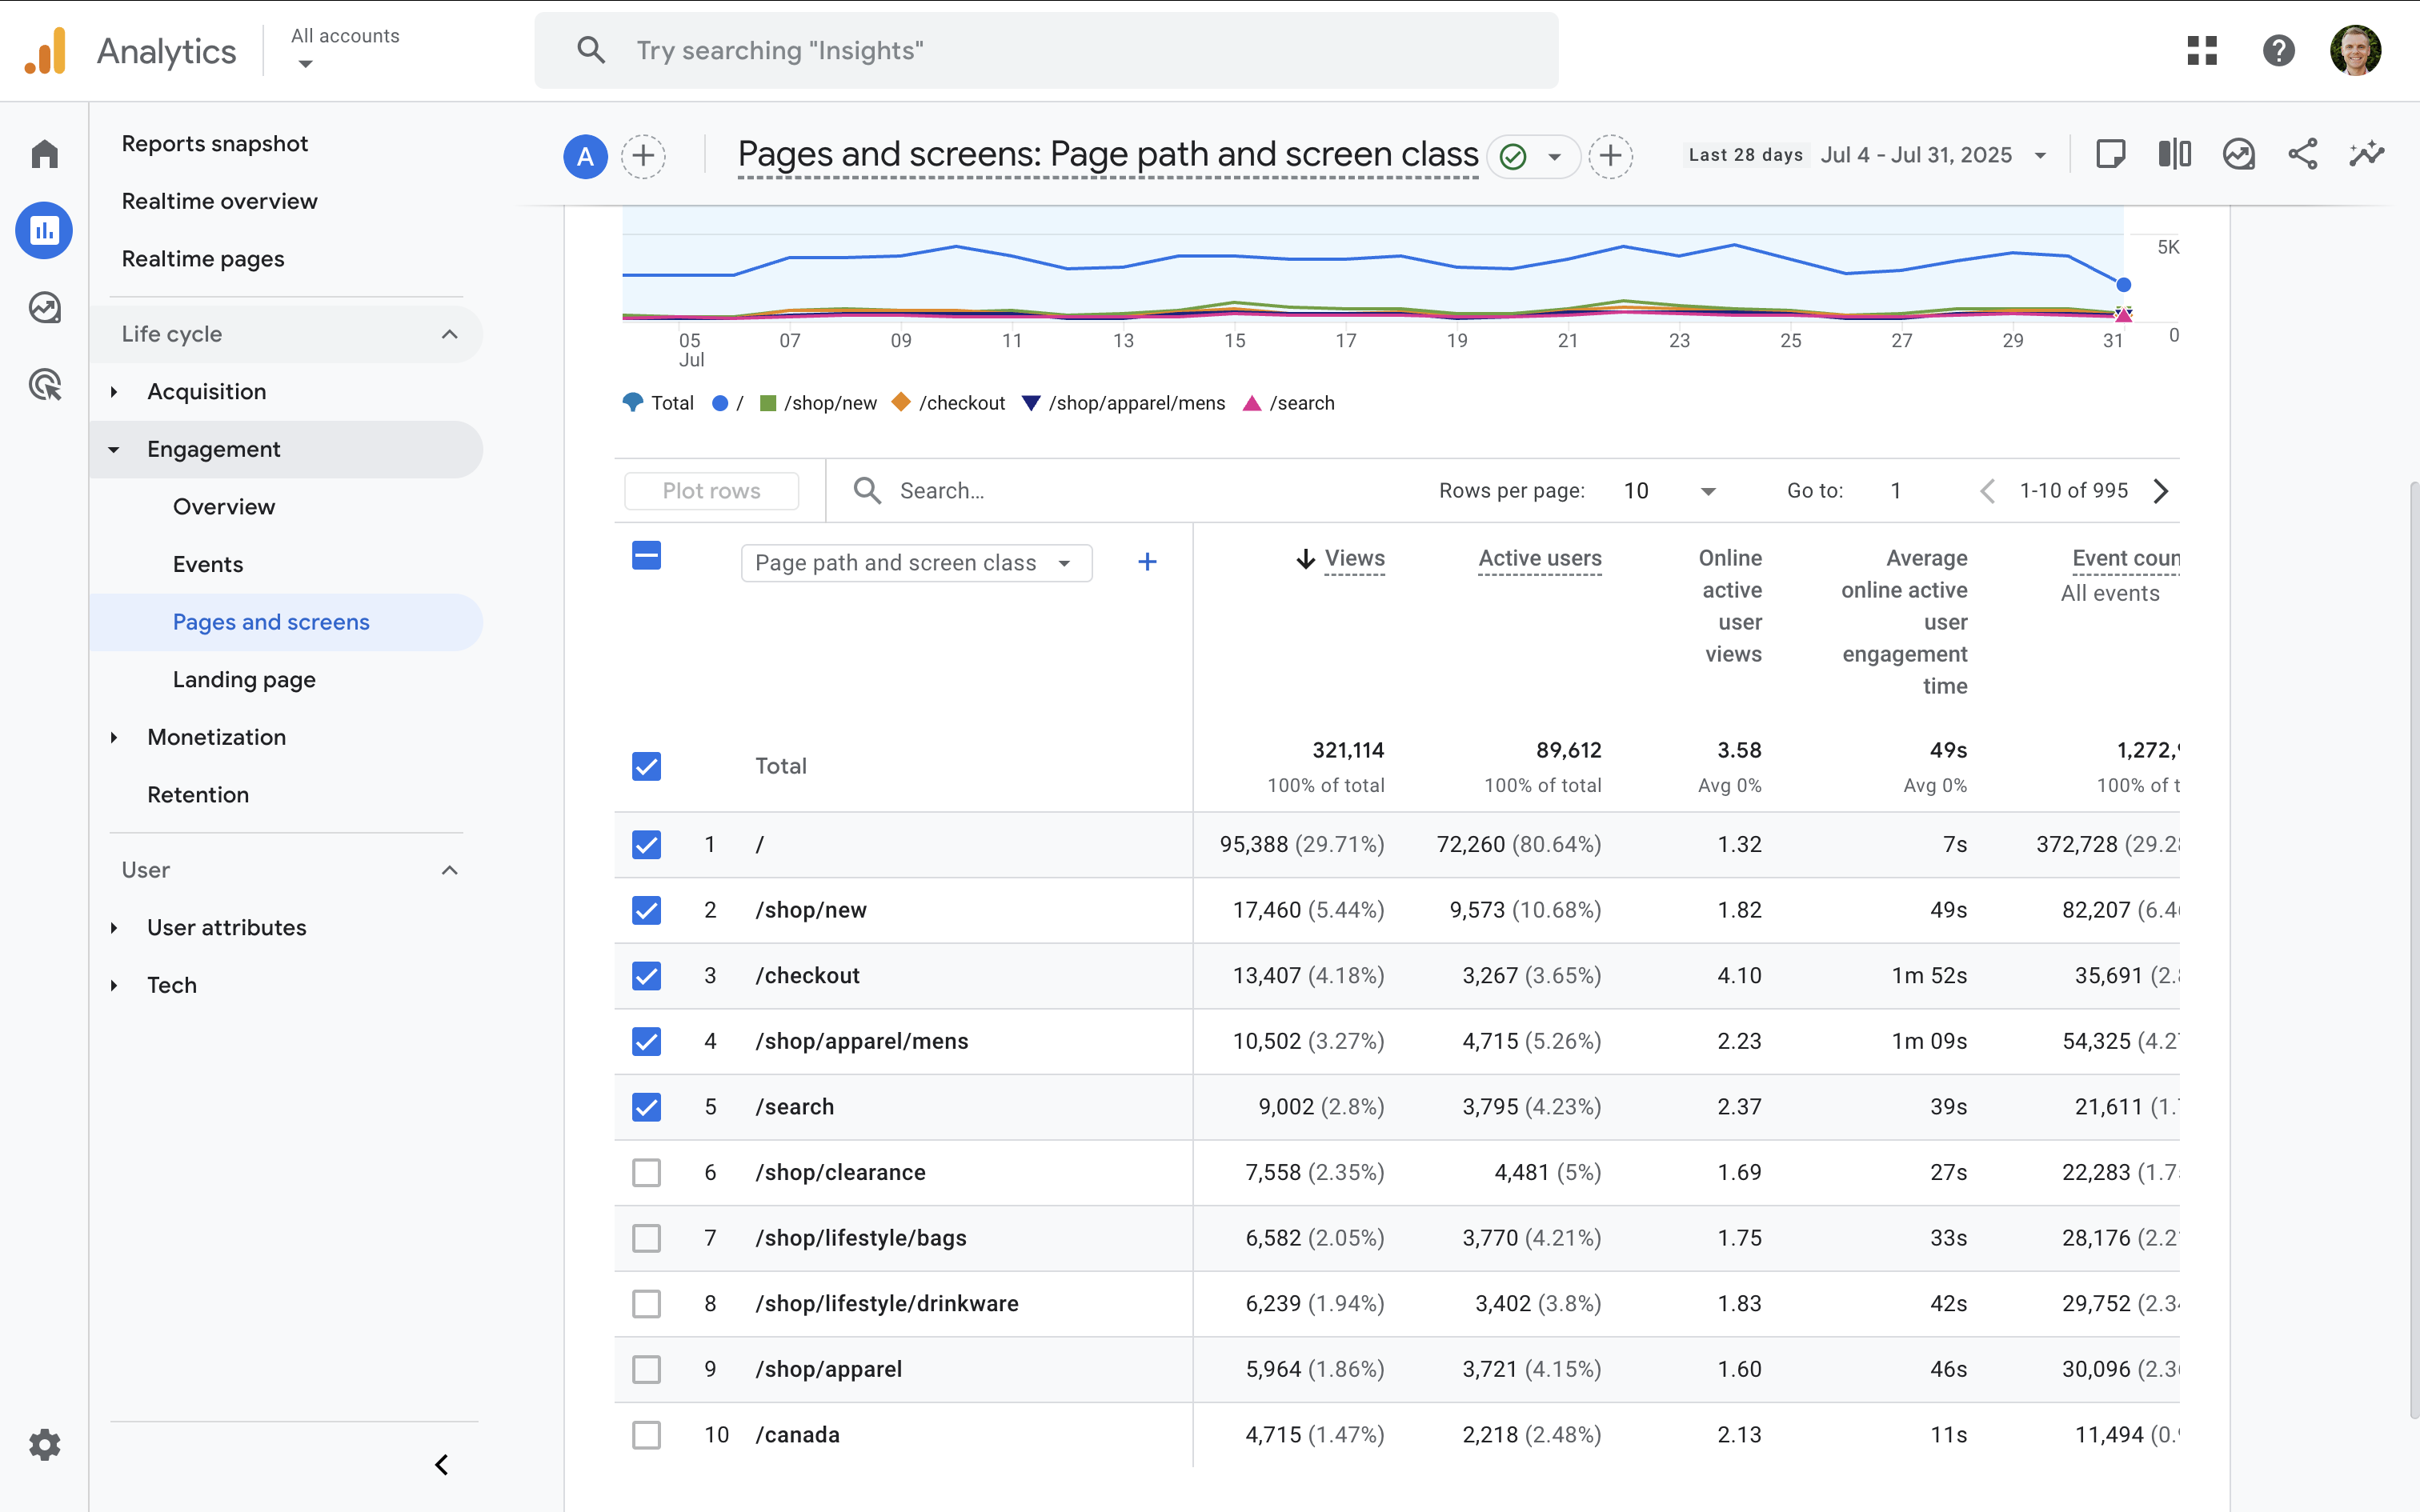
2. Engagement Reports
Understand how users interact with the website:
- Most viewed pages and average time per page
- Engagement rate and event tracking
- Site search behavior
- Exploration reports for deeper insights
The 'Pages and Screens' report shows which pages people have viewed on the website:
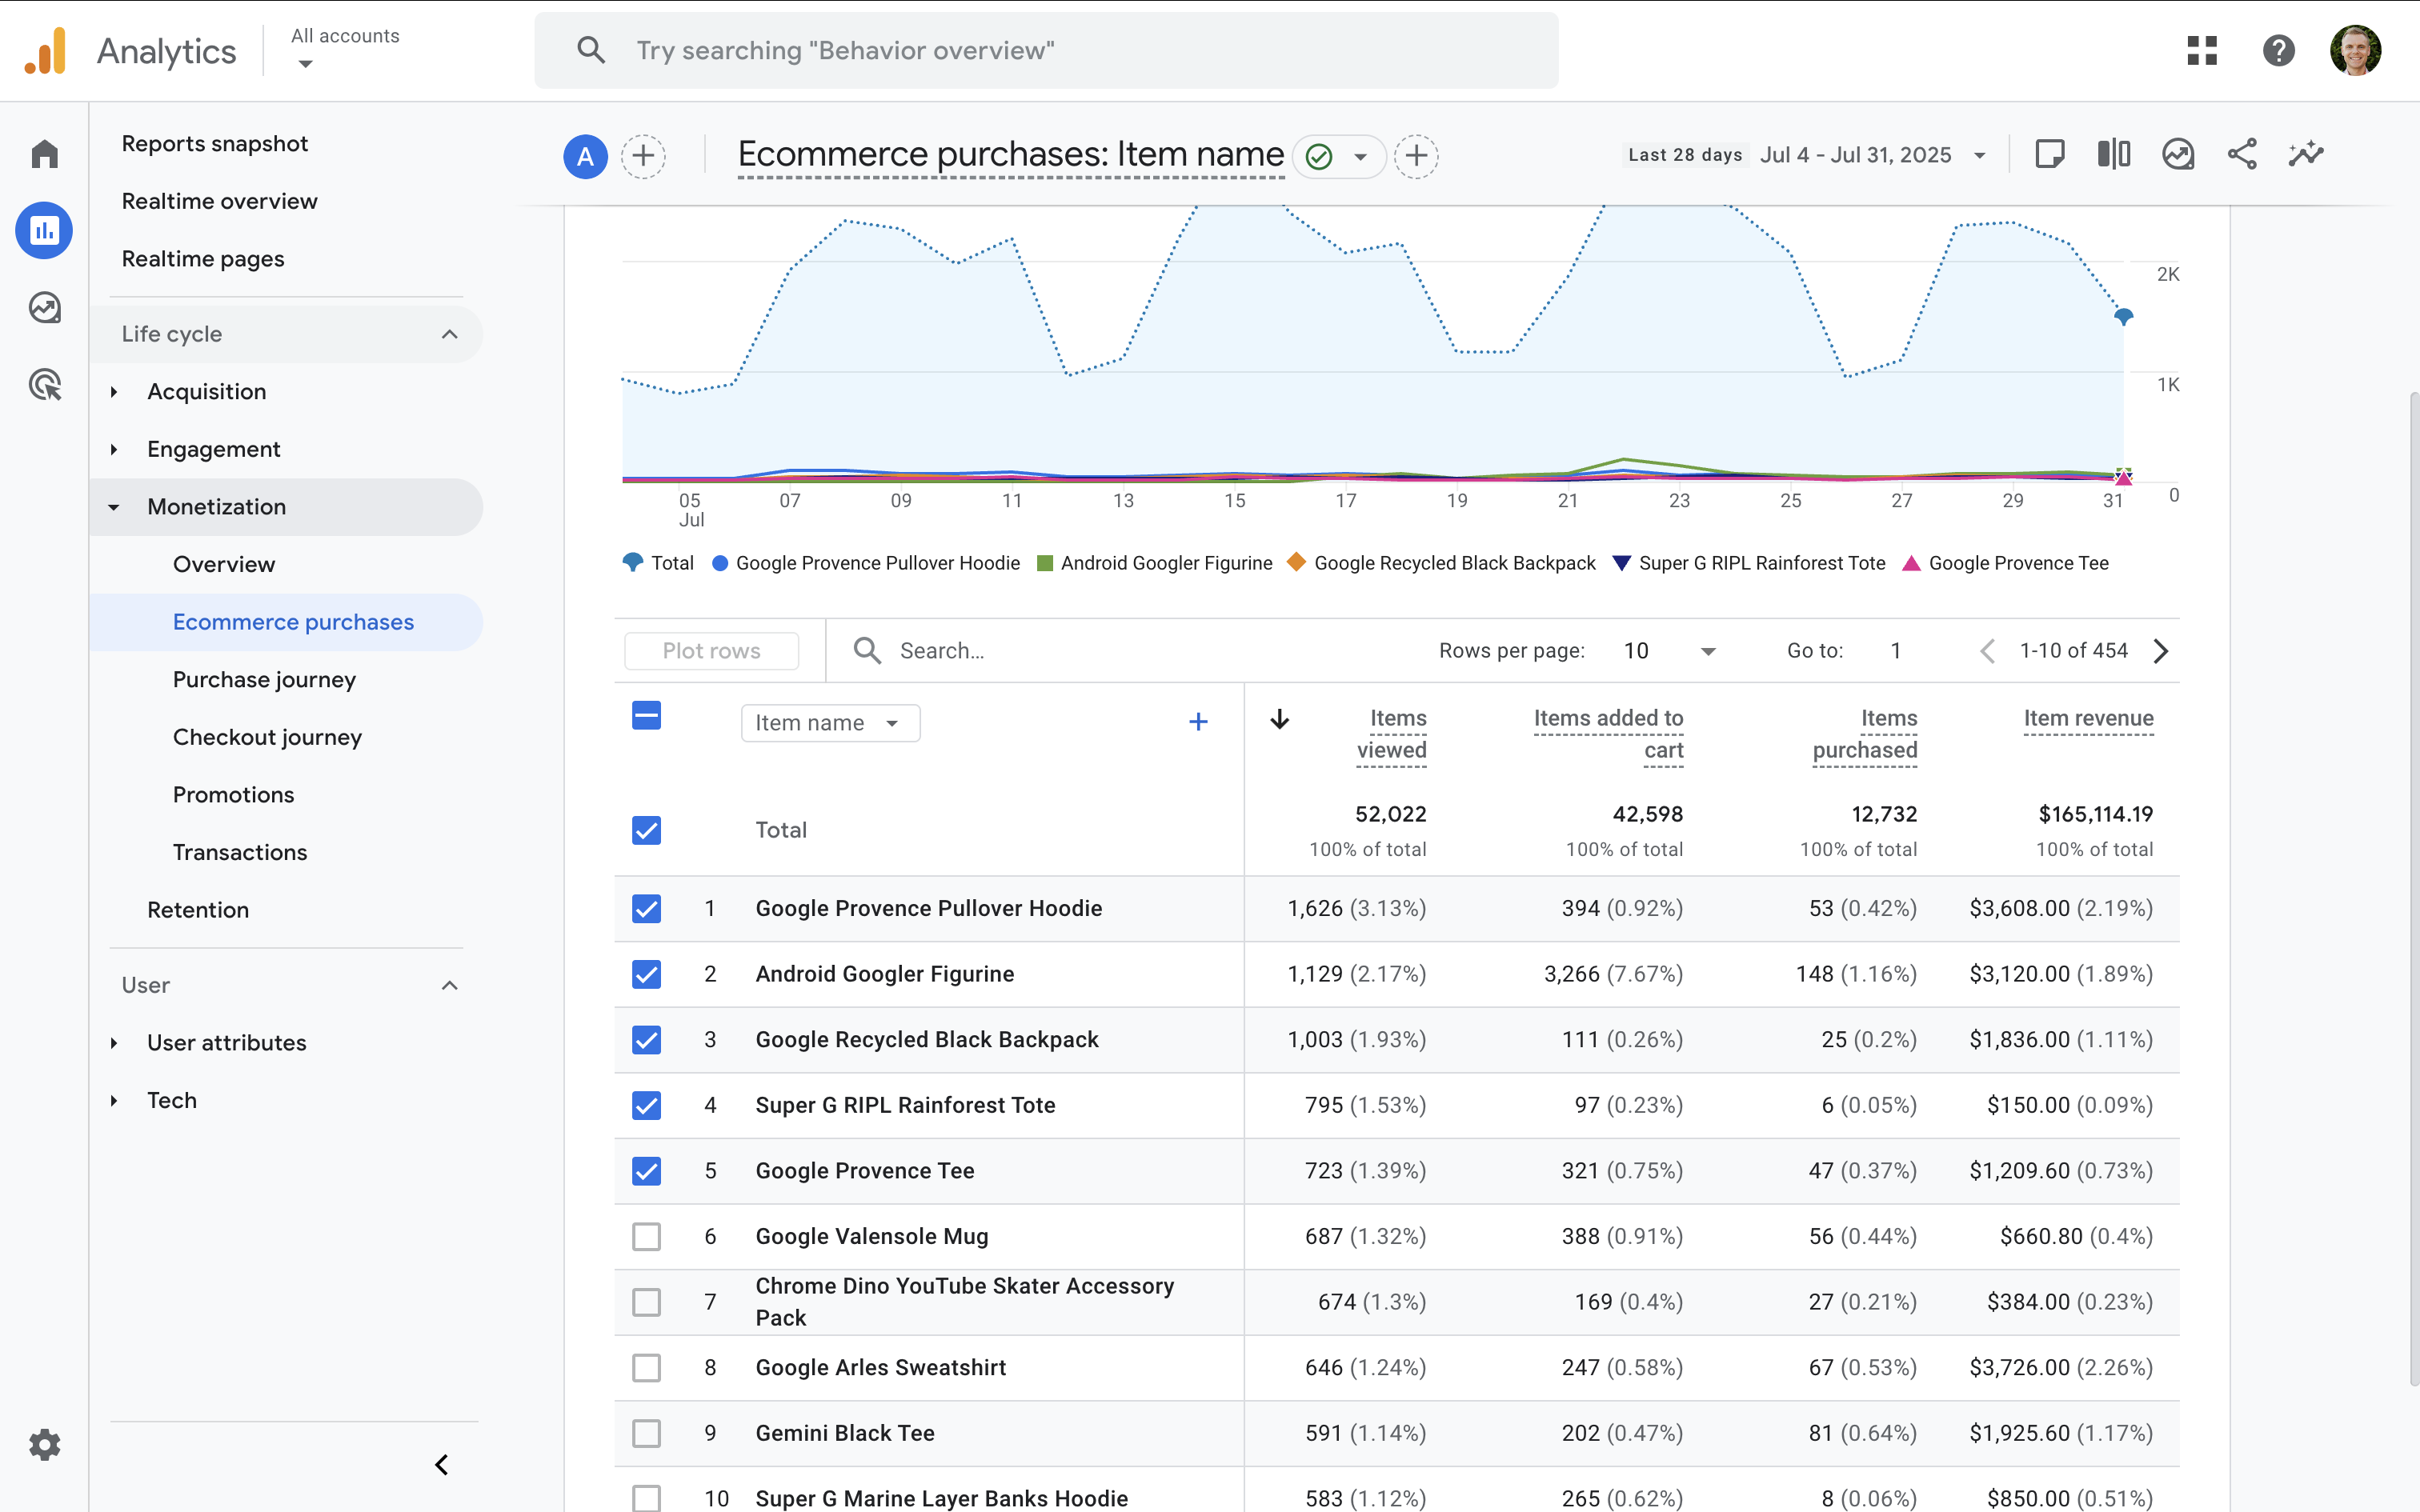
3. Monetization Reports
Track how users complete important actions:
- Ecommerce transactions and purchase metrics
- Path visualizations showing users who checkout and purchase
- Reports for product performance, promotional code usage, and more
Since the demo account includes ecommerce tracking, you can view the items people have purchased on the website:
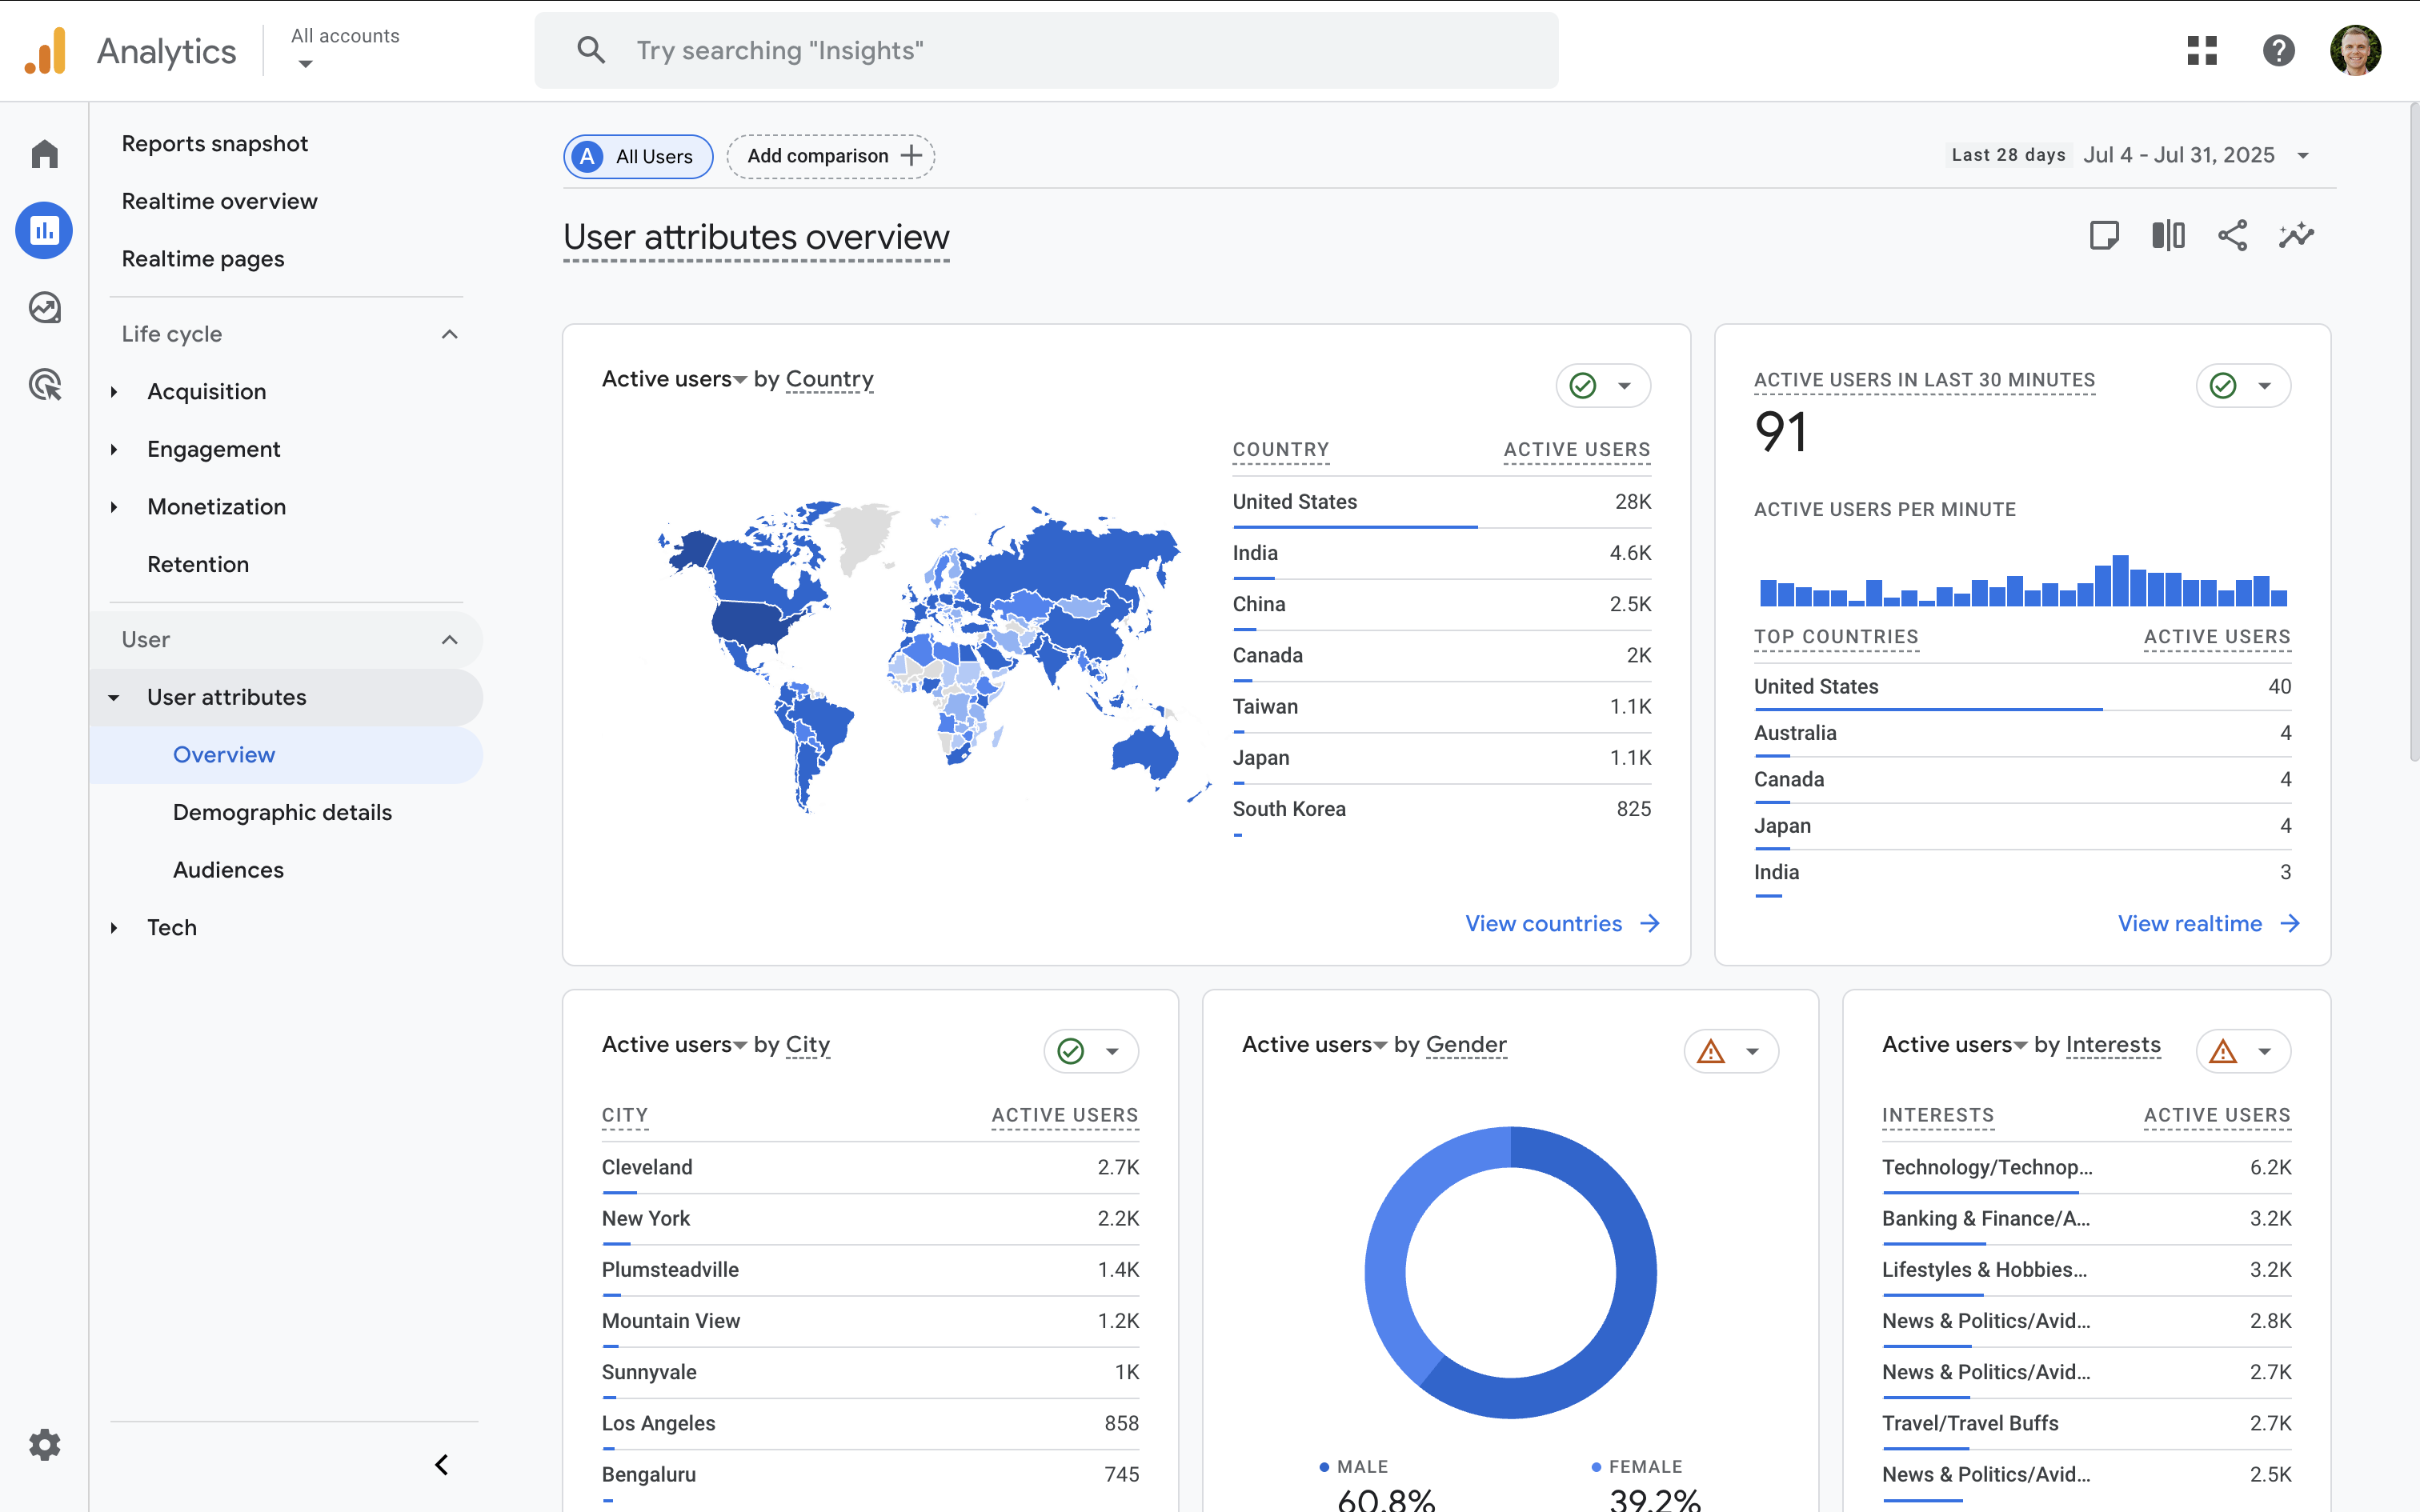
4. User Attributes Reports
Gain insights into your users through the 'Overview', 'Demographic Details' and 'Audiences' reports. In the Google Analytics demo account, you’ll see:
- Active users by country, city, and additional geographic dimensions
- Demographics like age, gender, and interests
- Devices, including browser versions and other technical breakdowns
- Default and custom audiences that have been created in the demo property
The 'User Attributes Overview' report includes a top-level snapshot about people who visit the website. This includes their geographic location, gender, age, interests, and other demographics:
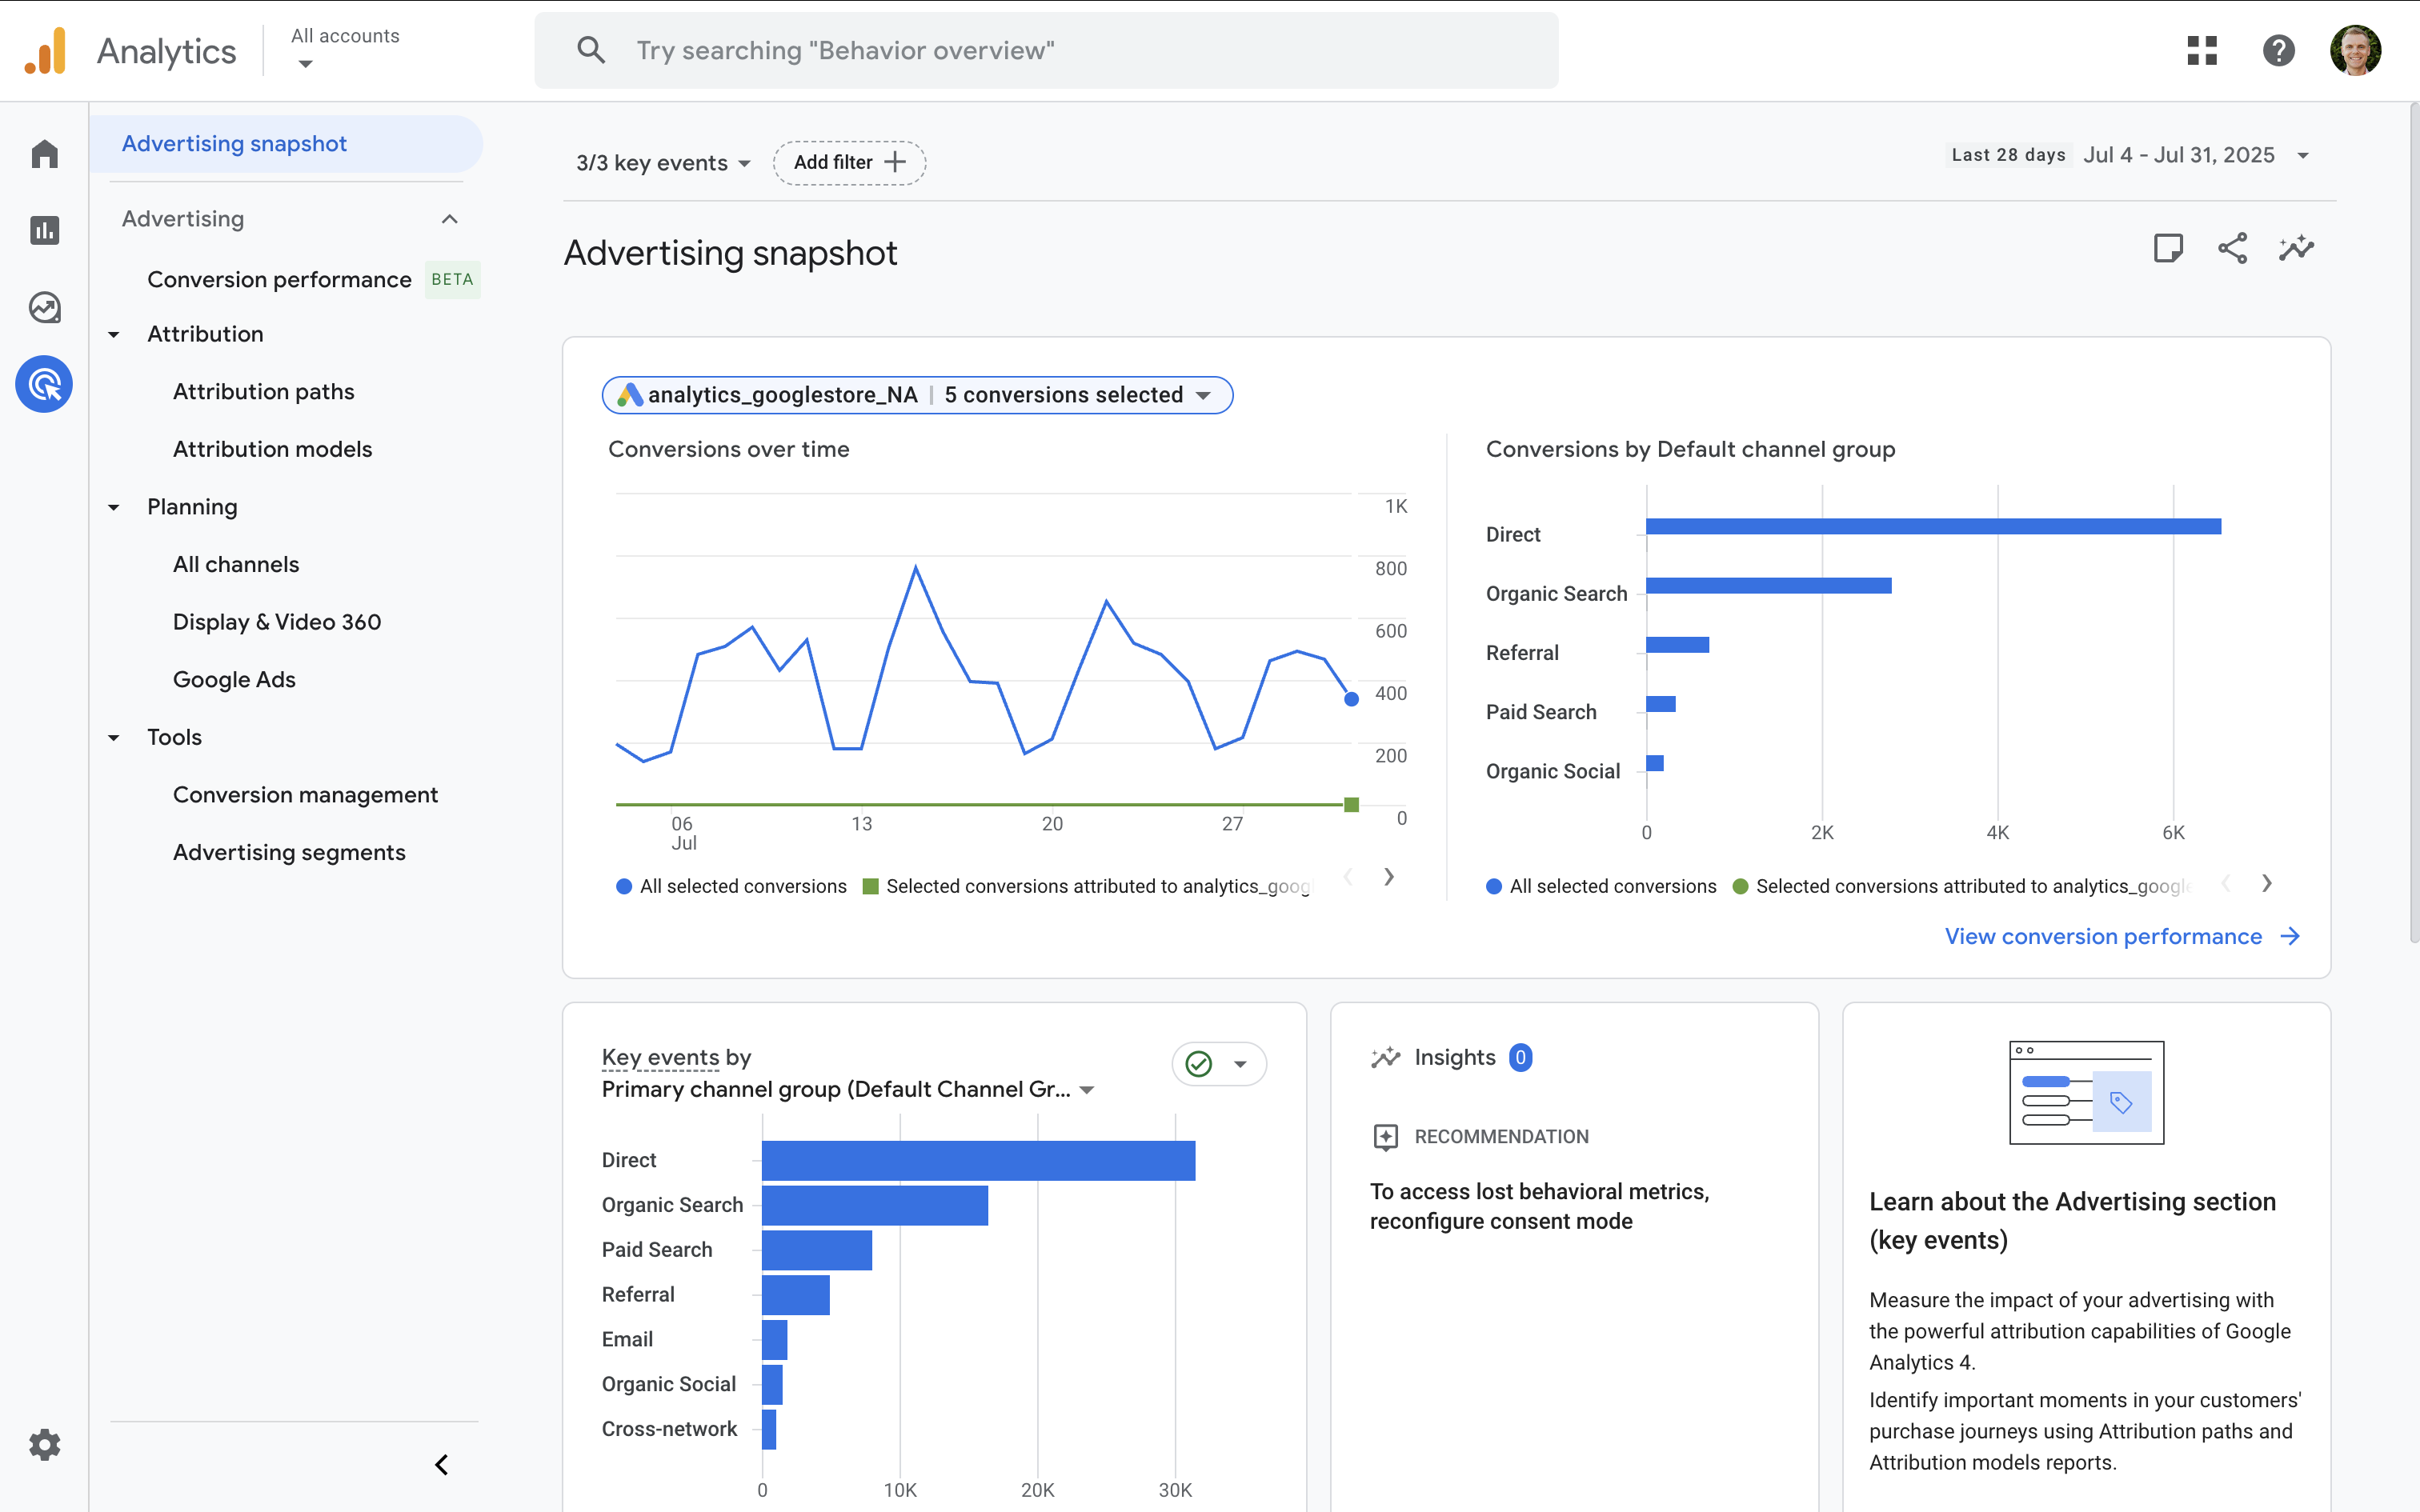
5. Advertising Reports
You can view attribution-based reports, including reports that focus on the performance of Google Ads campaigns by navigating to 'Advertising'. These reports include:
- Marketing channels and traffic sources
- Campaign performance insights
- Trends across different channels
Using the 'Advertising' reports lets you compare the performance of marketing campaigns in Google's demo:
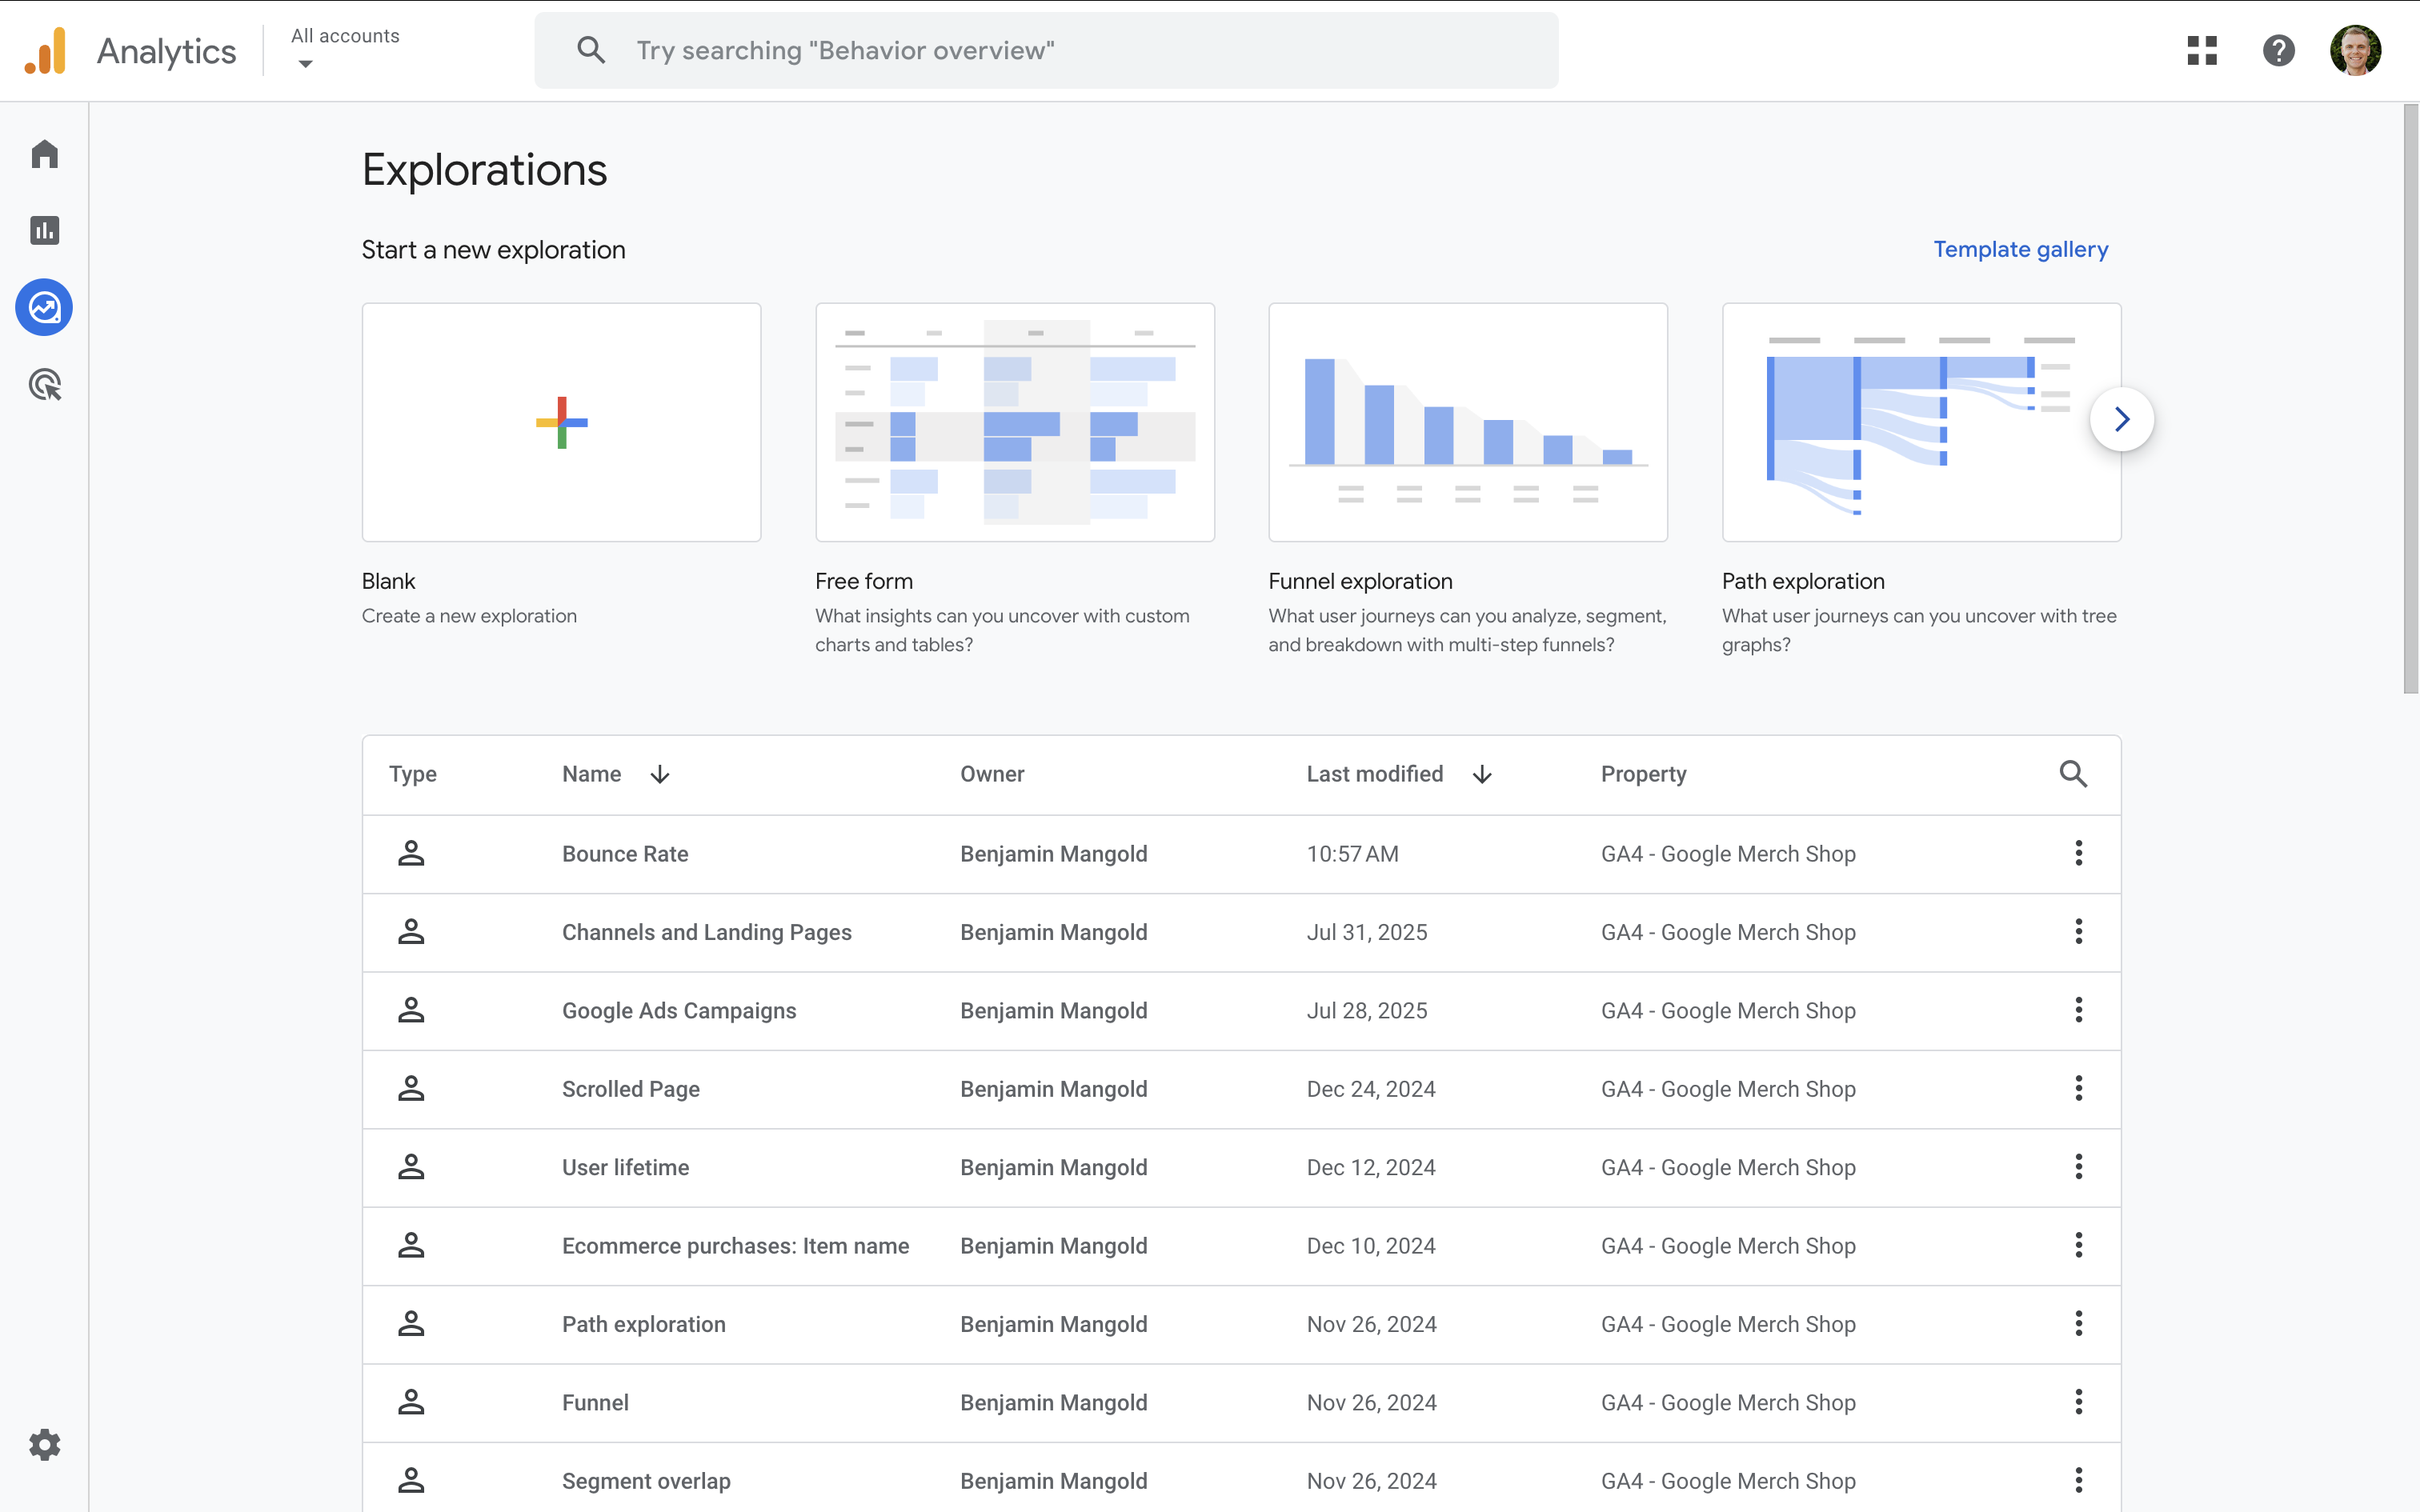
6. Exploration Reports
Apart from the standard reports, you can create custom Exploration reports to meet your individual reporting and analysis needs. Exploration reports allow you to present and visualize data using a range of chart and report types.
Here we can see templates to create new Exploration reports, along with reports that have already been created in the Google Analytics demo property:
To learn about the reports available in Google Analytics, join our GA4 course and watch our 15-minute quick-start tutorial:
Tips for Using the GA4 Demo Account
To make the most of the Google Analytics demo, try these expert tips:
- Use Comparisons and Segments: Filter reports to view behavior by device, location, or traffic source.
- Create Custom Exploration Reports: Tailor your data views using dimensions, metrics, and filters.
- Build Dashboards: Monitor KPIs with customizable dashboards for quick insights.
- Test Advanced Features: Try out funnel exploration, cohort analysis, data imports, and alerts.
Conclusion
The Google Analytics demo account is an exceptional tool for learning and practicing web analytics using live, real-world data. Whether you’re a complete beginner or looking to sharpen your skills in GA4, the Google Analytics demo gives you everything you need to explore the platform confidently.
By following the steps in this guide, you can unlock powerful insights, test advanced features, and become more proficient with Google Analytics.
Comments