Getting Started with Google Analytics 4 (GA4): A Beginner’s Guide to Reports
Benjamin Mangold
If you're looking to quickly get up to speed with Google Analytics 4 (GA4), you're in the right place. This guide will walk you through the essentials of using GA4, from understanding key reports to configuring your setup for meaningful data collection. Whether you're just starting or need a refresher, these steps will help you confidently navigate GA4 and unlock valuable insights for your website and marketing campaigns.
Table of Contents
- Overview of GA4 Reports
- Understanding GA4’s Standard Reports
- Check Important Configuration Settings
- Link GA4 to Other Google Products
- Resources and Next Steps
You can also watch this tutorial to follow along:
Overview of GA4 Reports
Start by logging into Google Analytics and opening your GA4 property. If you want to explore real data, you can use Google’s free demo account.
The Home report gives you a quick snapshot of what’s happening on your website. You’ll see:
- Active Users – People who visited your site in the selected date range.
- Event Count – All tracked interactions, including page views and custom events.
- Key Events – Conversions and important actions you’ve marked in your settings.
- Purchases – If you’re tracking ecommerce, this shows completed transactions.
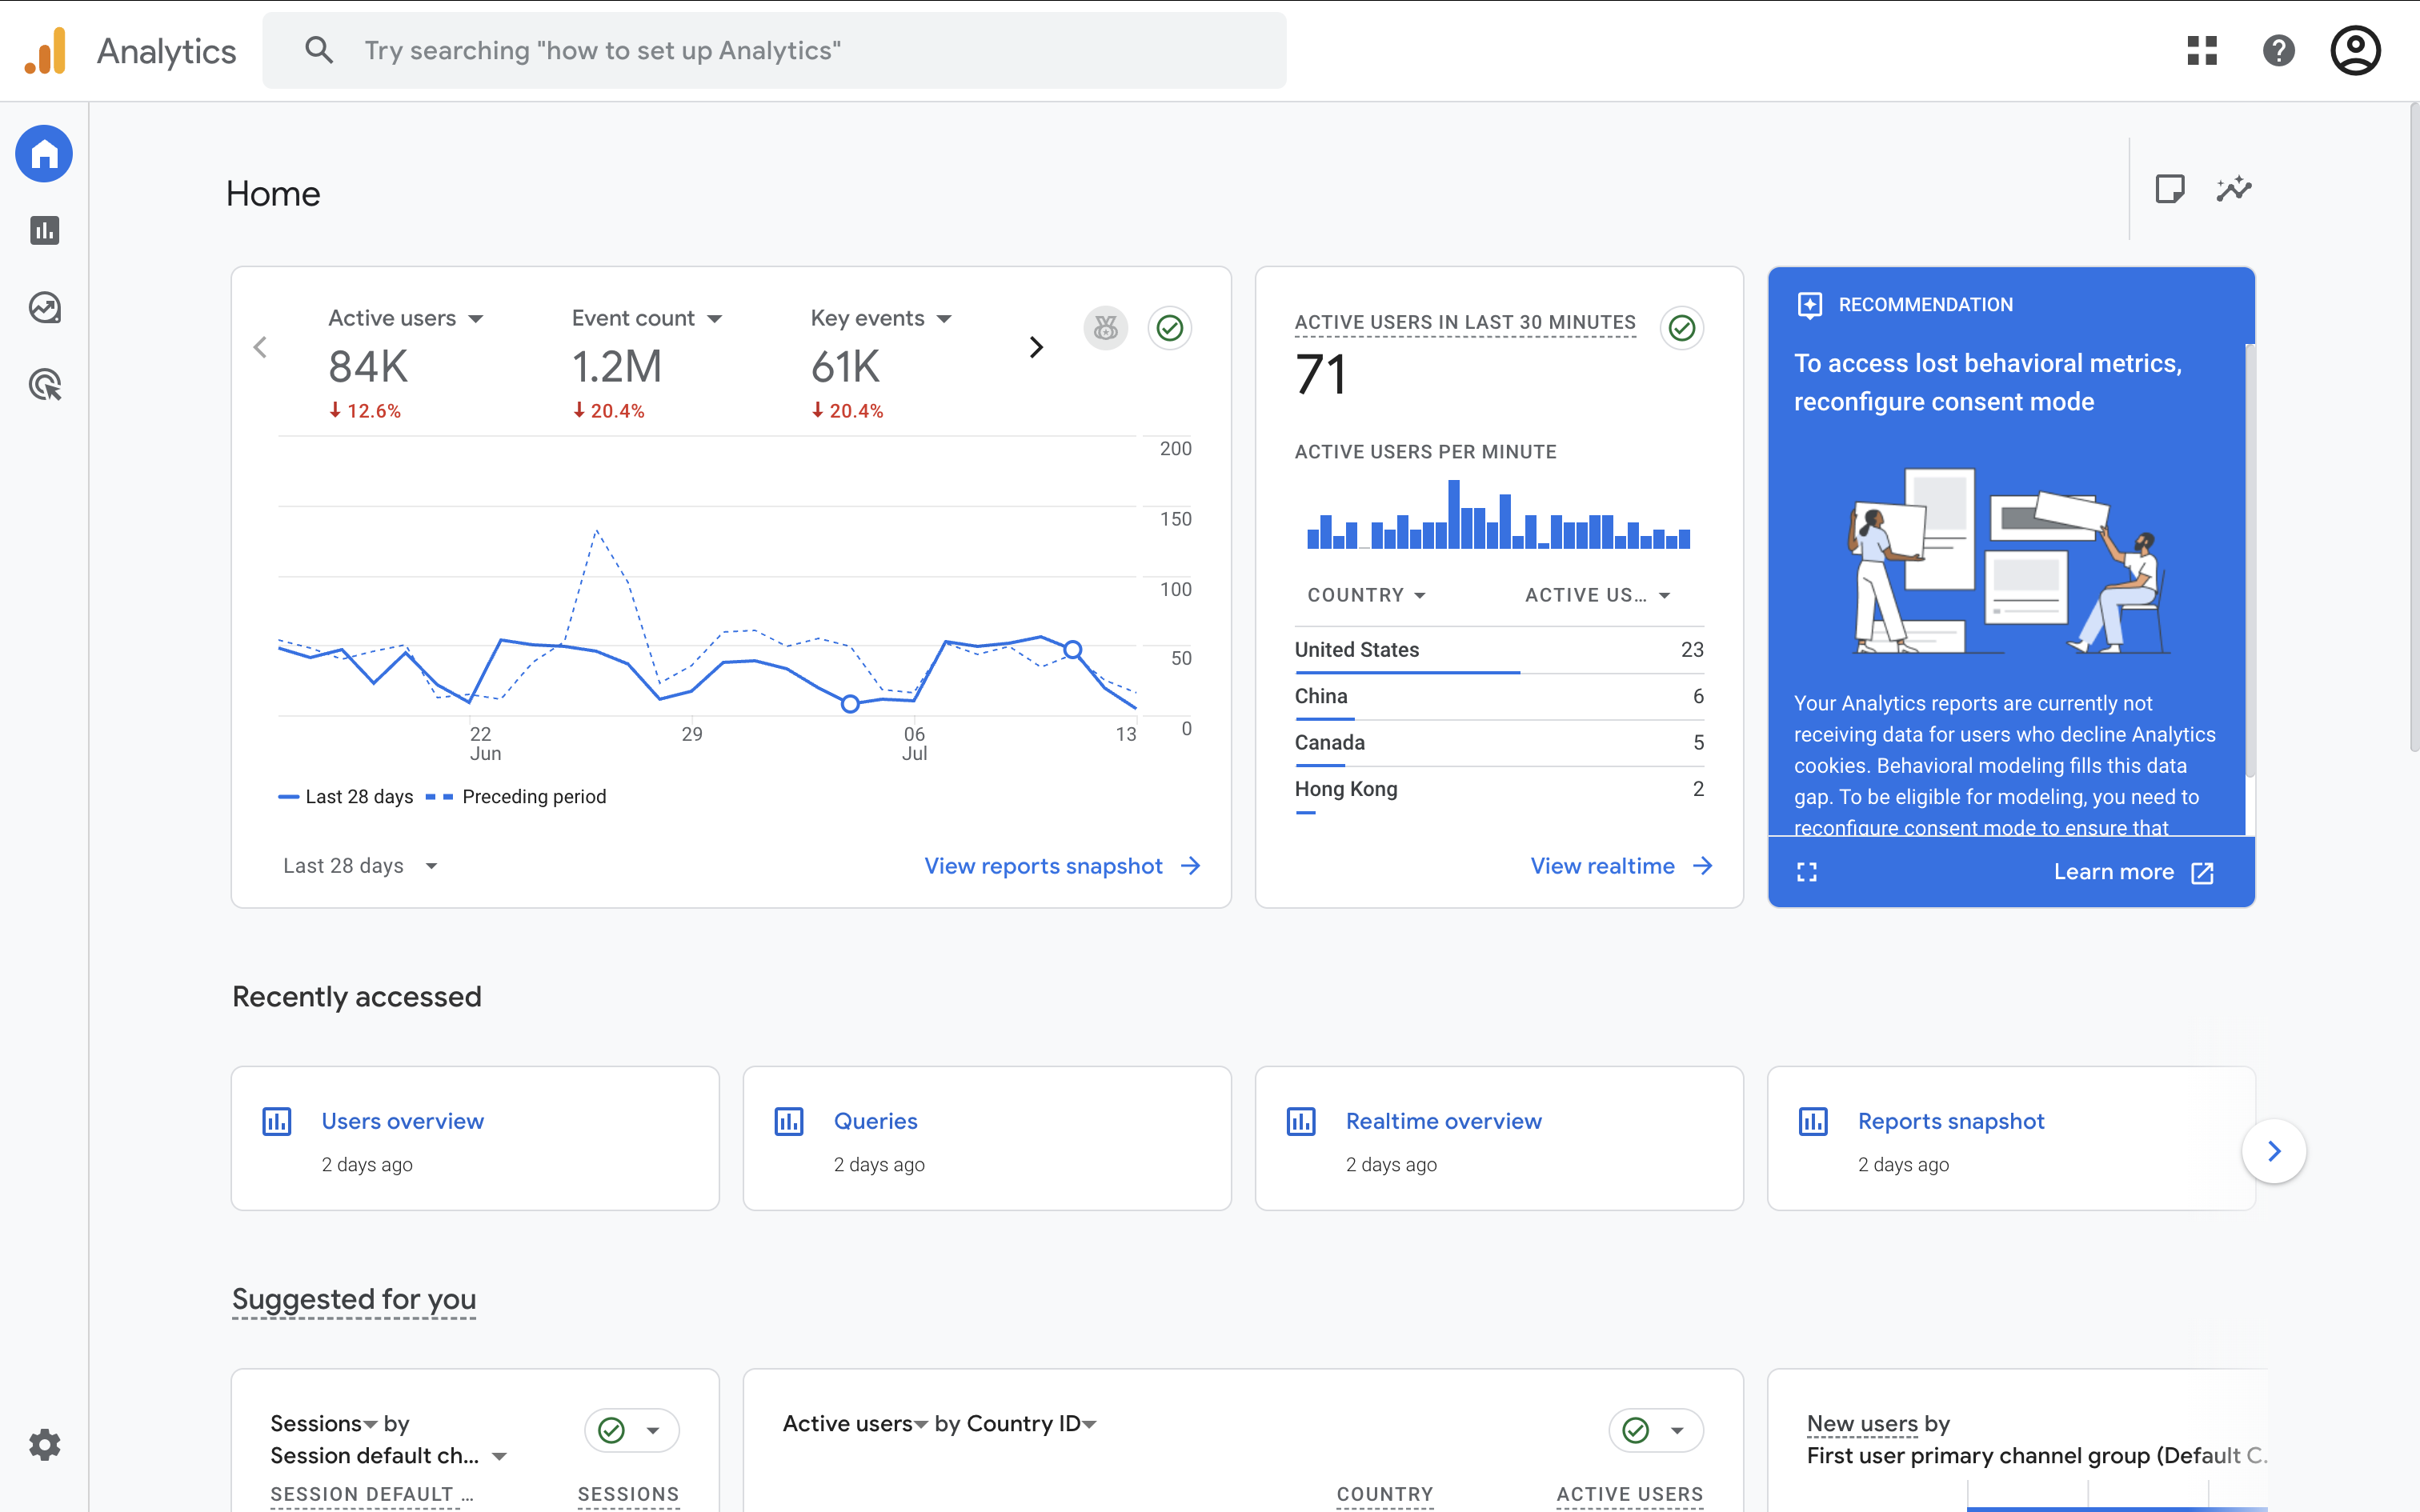
Scroll down to view real-time users, recently accessed reports, and insights powered by machine learning. The Insights card can help you spot trends or anomalies – keep an eye on it regularly.
Understanding GA4’s Standard Reports
GA4’s reports are grouped into sections like Acquisition, Engagement, Monetization, and more. Here are some highlights to help you get started:
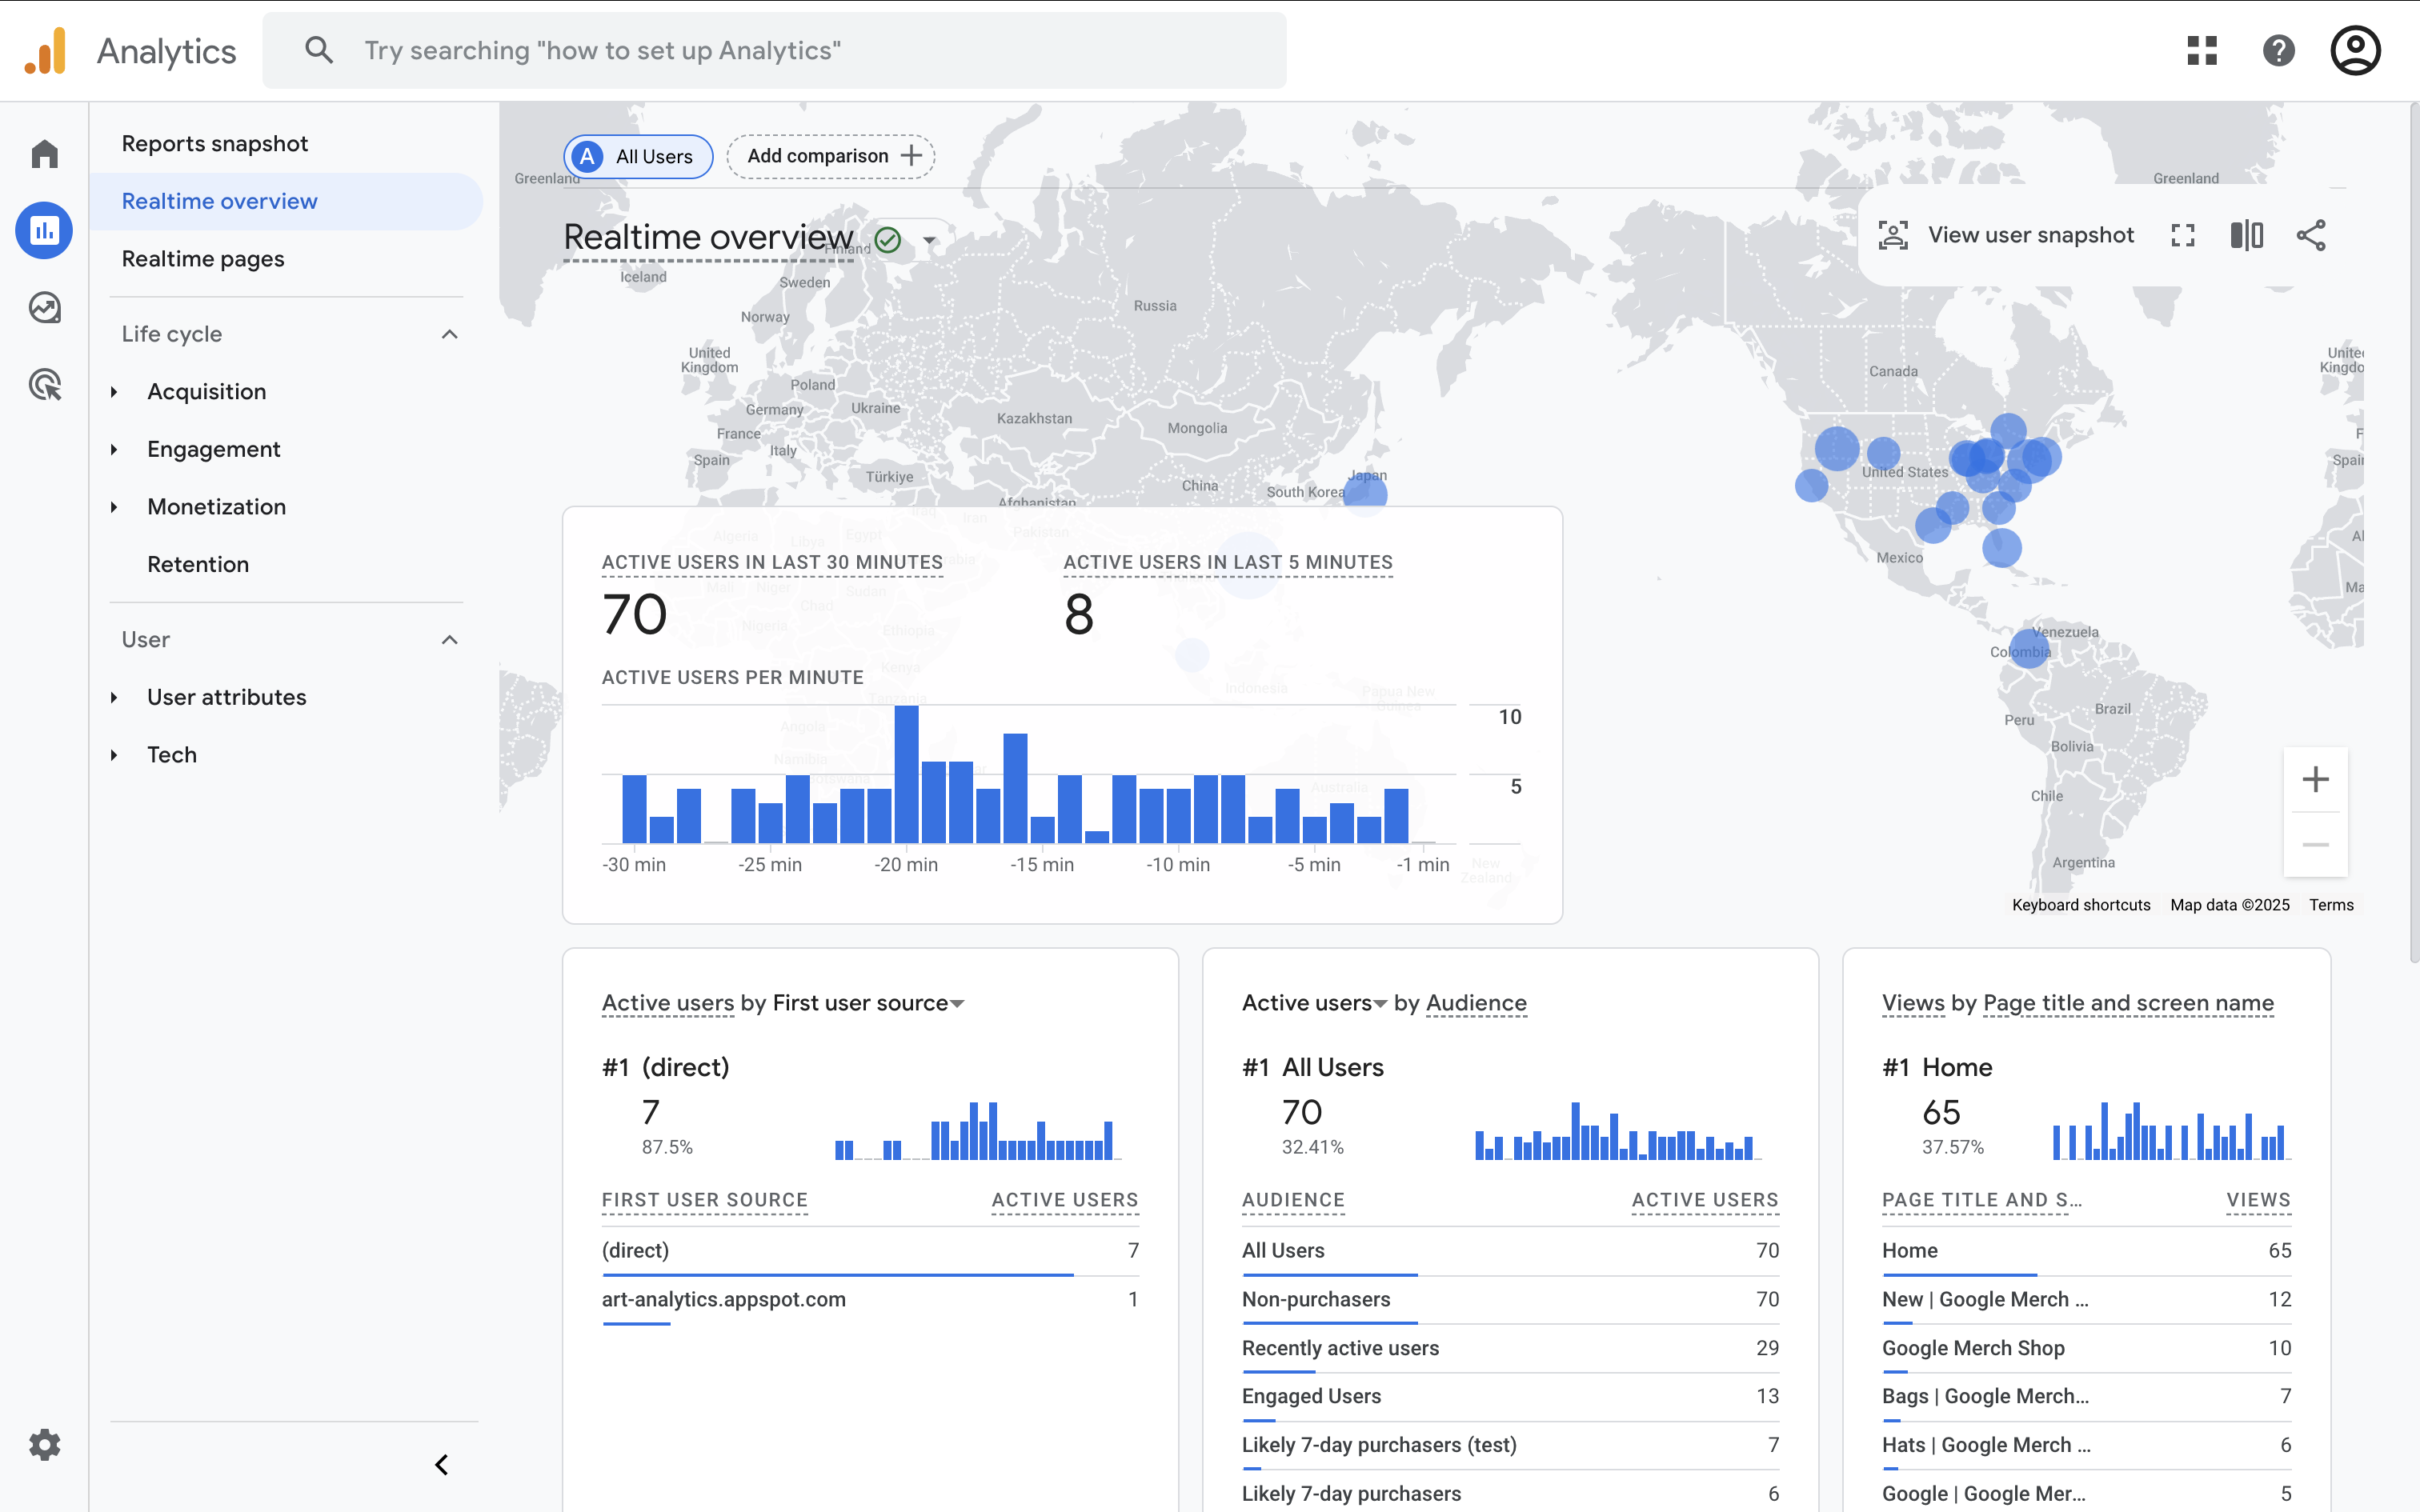
Realtime Reports
See what’s happening on your website right now – updated in seconds. You’ll find:
- User locations
- Traffic sources
- Pages being viewed
- Events being triggered
Acquisition Reports
These show how people find your website:
- User Acquisition – How new users first found your website.
- Traffic Acquisition – How sessions begin, even for returning users.

Engagement Reports
Understand what people do on your site:
- Pages and Screens – View your most visited content.
- Events – Includes automatically tracked events and any custom events you’ve added (like scrolls, clicks, and video views).

User Attributes and Demographics
Discover who your users are, including their location, language, and – if Google Signals is enabled – age, gender, and interests.

Technology Reports
Find out what devices and browsers people are using to access your site, so you can optimize your design and experience.

Check Important Configuration Settings
It's always a good idea to review settings for your GA4 property, especially if they haven't been checked in a while. You’ll need Editor or Administrator permission for the property. To check your settings, navigate to 'Admin'. Here are some important options to check:
- Time Zone and Currency – Navigate to 'Property' and select 'Property Details'. Check that the correct time zone and currency are selected. These settings affect how your data is reported. (If you need to change the time zone setting, you will see a gap or overlap in data depending on the new time zone that has been selected.)
- Data Stream – You can find the data stream (or streams) that are used to collect data into your reports by navigating to 'Data Collection and Modification' and selecting 'Data Streams'. This is where you can find your Measurement ID (which is needed to install Google Analytics on your website) and configure additional settings.
- Enhanced Measurement – While you still have your data stream open, you can review what’s being tracked automatically, like scrolls, form interactions, and outbound clicks. To view your settings click the configuration icon under 'Enhanced Measurement'. You can then toggle each of the options on or off as needed.

- Data Retention – Under 'Data Collection and Modification', select 'Data Retention'. These settings let you control how much individual user-based historical data is available in your reports. In most cases you will want to select 14 months unless you have a reason to remove this data sooner.
- Key Events (Conversions) – Navigate to 'Data Display' and choose 'Events'. You can then select the 'Recent Events' tab to view events that have been collected into your reports. To count an event as a conversion action, you can click the star icon next to the event (or events). These events will now be marked as 'Key Events' so you can use them to report on conversions in GA4.
Link GA4 to Other Google Products
For a more complete setup, it's worth taking the time to link GA4 with other tools including:
- Google Ads – Share audiences and track performance more effectively.
- Search Console – Access organic search insights inside GA4.
To do this, navigate to ‘Admin’ and select ‘Product Links’ under your property settings.
Resources and Next Steps
Now that you're familiar with the basics, take some time to explore your own reports. Look at where your users come from, what content keeps them engaged, and what leads to conversions.
As you become more confident, try creating Custom Exploration reports (available under 'Explore') to dig deeper into your audience and performance trends.
Want to go further? Check out these tutorials:
- Google Analytics Glossary
- GA4 Event Tracking
- Understanding the Key Events (Conversions)
- Ecommerce Tracking in GA4
Conclusion
GA4 is a powerful platform that gives you a complete view of how people interact with your website. Once you’ve explored the reports and checked your key settings, you’ll be in a great position to start using data to make smarter marketing decisions.
Remember – it’s okay to start small. Keep exploring, get comfortable with the interface, and check out additional tutorials when you’re ready to go deeper.
Ready to build your skills? Explore the full GA4 training course from Loves Data