How To Track Page Load Time In GA4 (Google Analytics 4)
Benjamin Mangold
Do you want to track the loading time of pages in GA4 (Google Analytics 4)? If you’ve been using Universal Analytics, the previous version of Google Analytics, then you might also be wondering where the ‘Site Speed’ reports have gone in GA4. Currently, there is no ‘Page Timings’ report in GA4 and there are no page load time metrics either. Google might (or might not) add loading time metrics to GA4, so let’s look at how we can report on the loading time of our pages in Google Analytics using Google Tag Manager.
We’re going to travel through each step in the post, but if you would prefer to watch the page load time tutorial, here it is:
Requirements Before You Begin
You’ll need to be using Google Tag Manager (GTM) and check that you have a Google Tag configured in your GTM container to send data to your GA4 property.
If you're just getting started with GTM, I recommend watching my GTM tutorial series on YouTube and joining my GTM course. You will learn how to get started, including the steps to implement Google Analytics.
Step 1: Create a JavaScript Variable
Create a custom JavaScript variable in GTM that includes this code:
function() {
    if (window.performance && window.performance.getEntriesByType) {
        var entries = window.performance.getEntriesByType("navigation");
        if (entries.length > 0) {
            var navTiming = entries[0];
            var pageLoadTime = navTiming.loadEventEnd - navTiming.startTime;
            return Math.round(((pageLoadTime / 1000) + Number.EPSILON) * 100) / 100;
        }
    }
}
Here’s what the variable looks like in GTM:
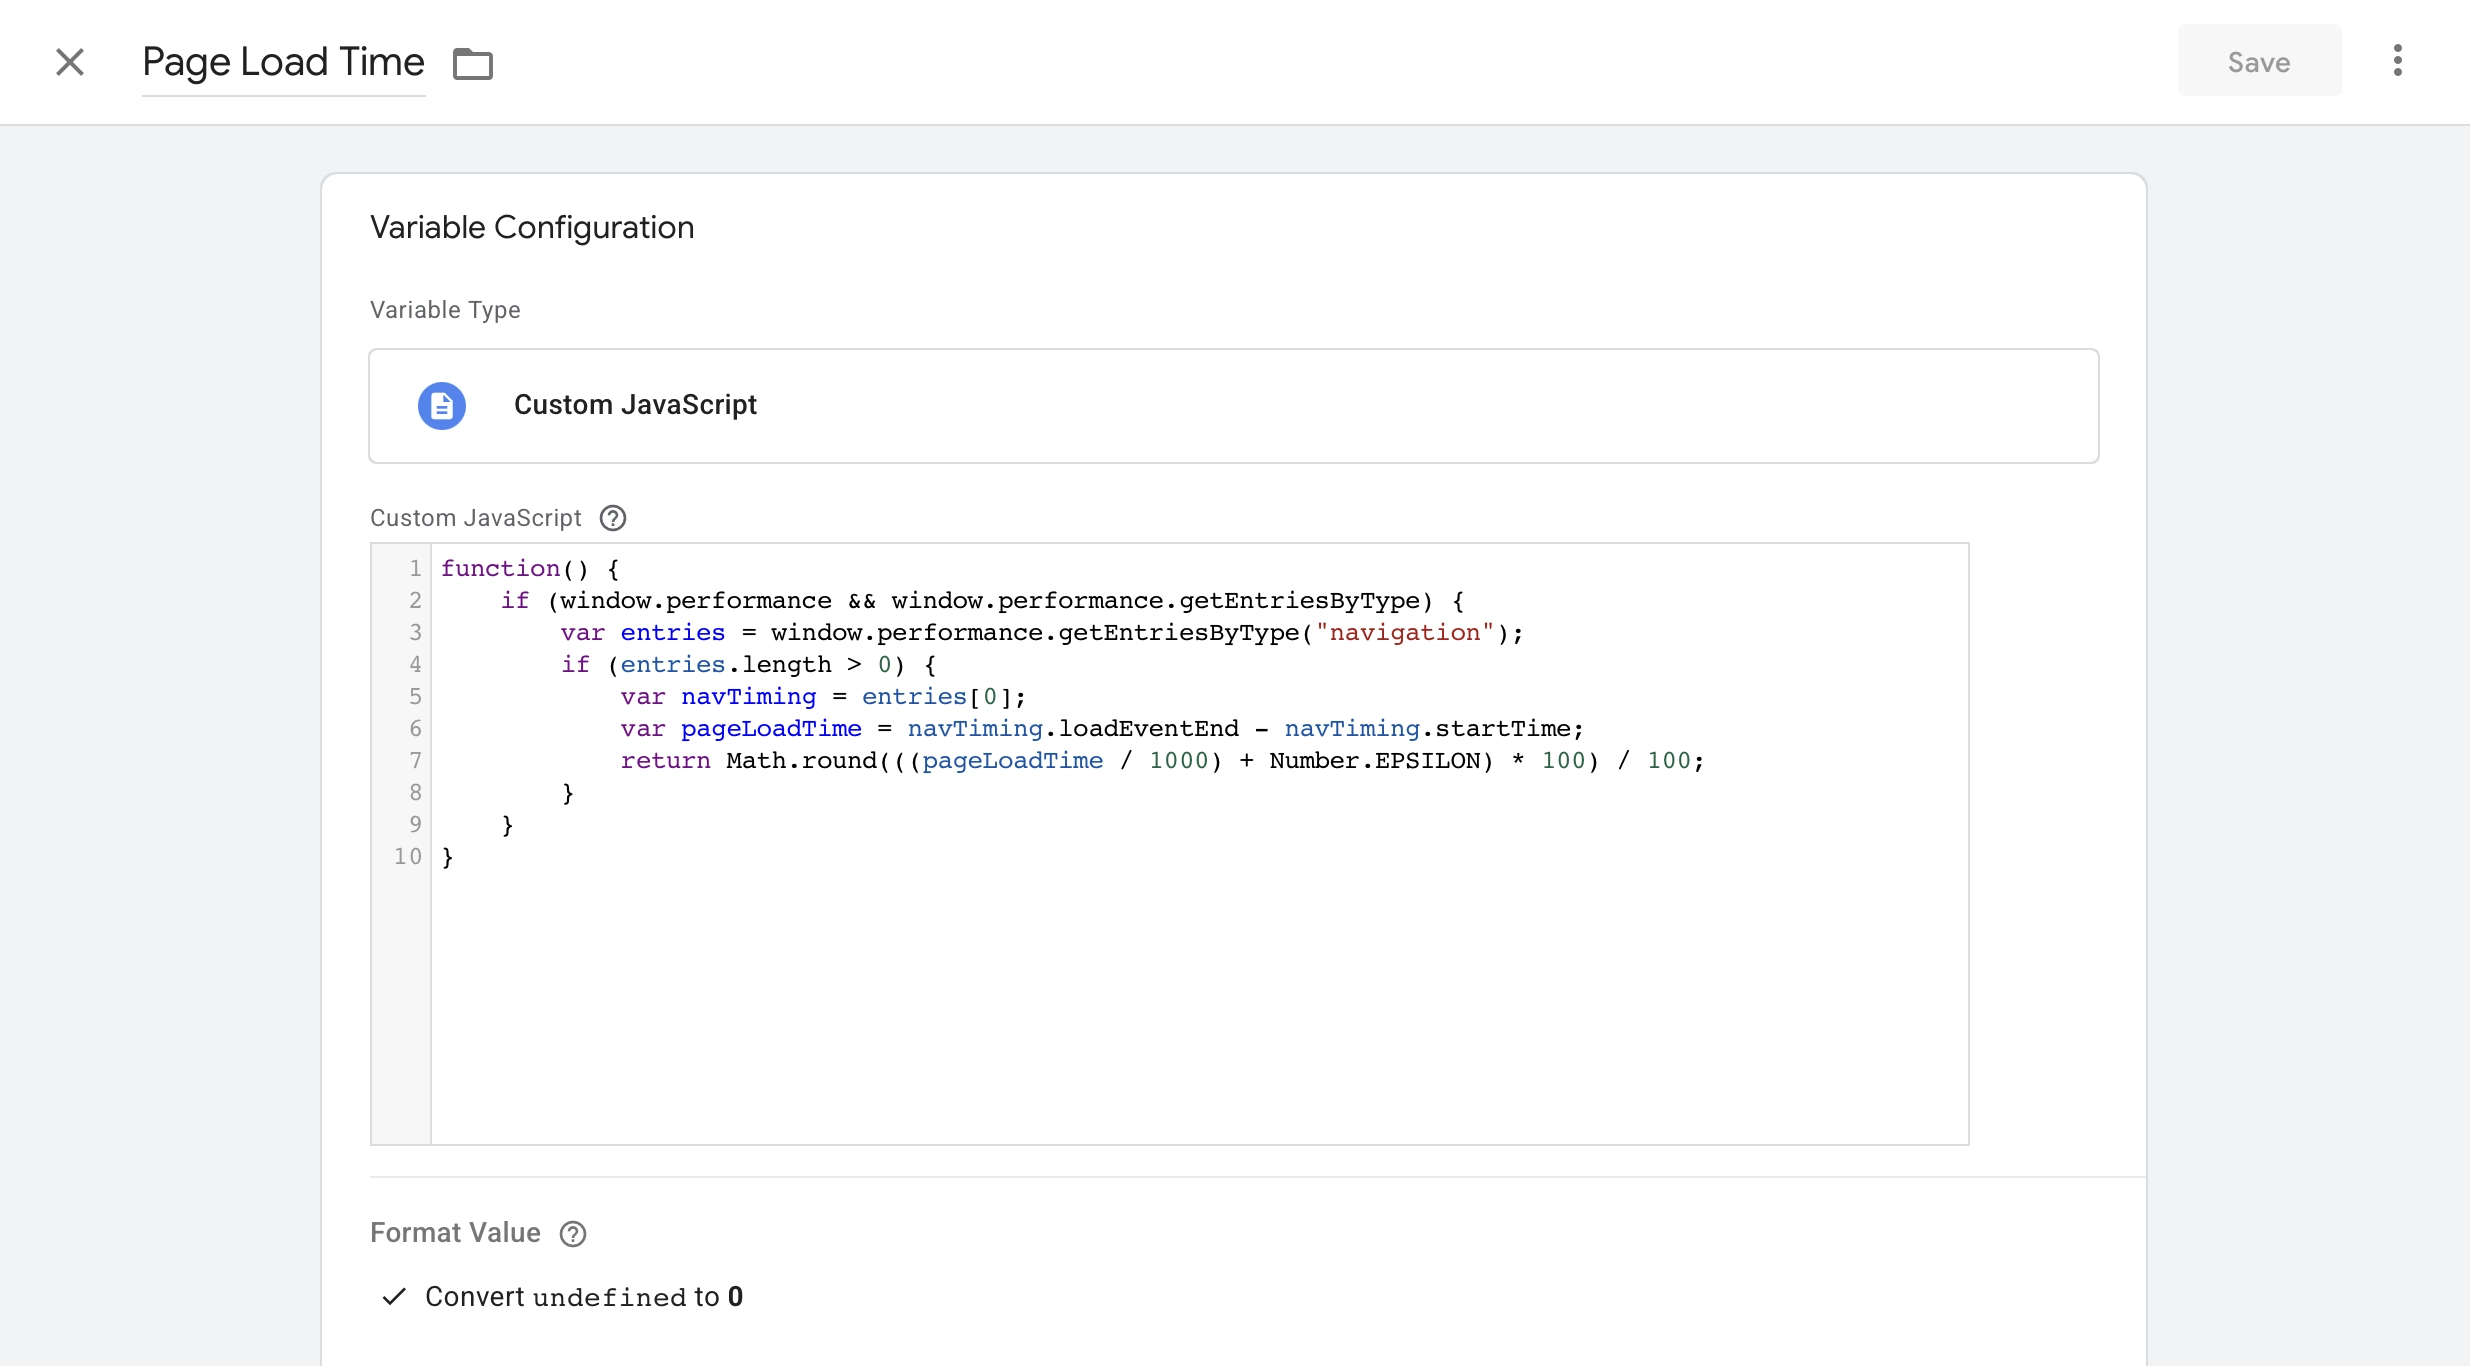
This custom JavaScript variable uses the Performance Navigation Timing API to calculate the amount of time (in milliseconds) between the loadEventEnd and the startTime which gives us the page load time. The code then take the number of milliseconds and convert it to seconds.
Thank you to Dave in the comments for suggesting updates to the JavaScript variable.
Tip: You can adjust the script so that it reports milliseconds instead of seconds for more granular reporting of page loading time in Google Analytics. Here’s a version of the code that will give you milliseconds instead of seconds:
function() {
    if (window.performance && window.performance.getEntriesByType) {
        var entries = window.performance.getEntriesByType("navigation");
        if (entries.length > 0) {
            var navTiming = entries[0];
            var pageLoadTime = navTiming.loadEventEnd - navTiming.startTime;
            return Math.round((pageLoadTime + Number.EPSILON) * 100) / 100;
        }
    }
}
Step 2: Create a Trigger
The next step is to create a trigger that will fire our GA4 event tag. We’re going to create a trigger when using the ‘Page View - Window Loaded’ trigger type. We’re also going to apply a condition to the trigger, so that our tag only fires when the page load time variable has a value greater than zero.
Here’s an example of what the trigger will look like:
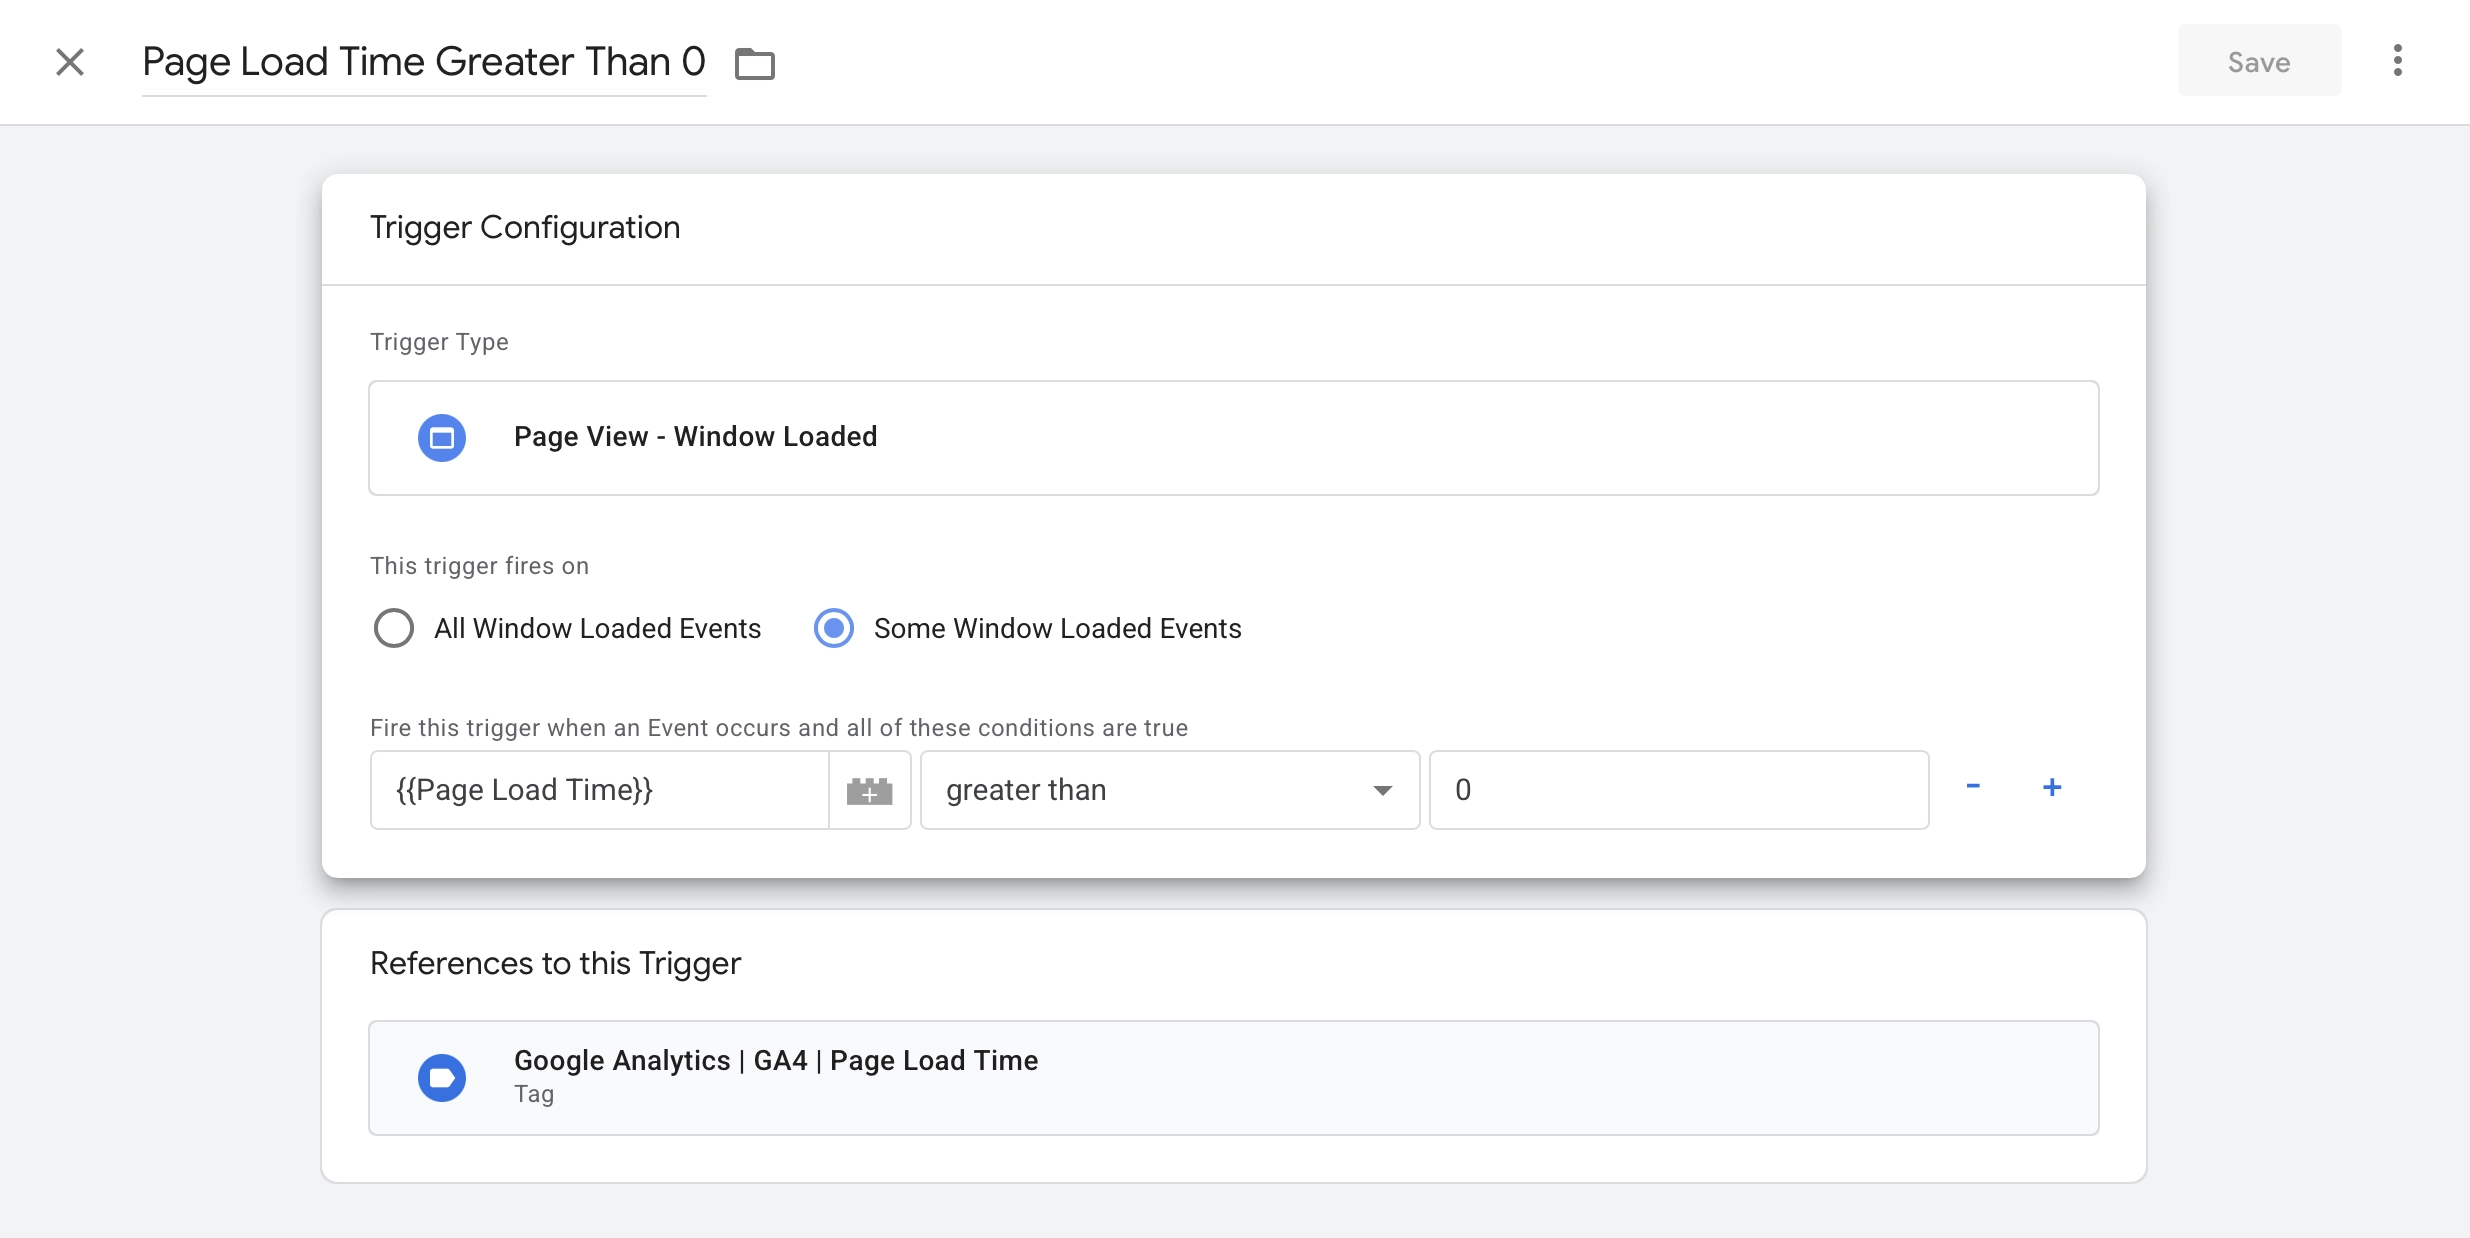
We’re adding this condition to make sure the tag only fires when a page load time has actually been recorded. If the value is zero (or missing), then it likely means the browser didn’t provide a valid timing value – and we don’t want to send incomplete data to Google Analytics. So by checking that the value is greater than zero, we’re helping to ensure we collect accurate data.
Thank you to Tappu in the comments for suggesting updates to the trigger.
Step 3: Create a GA4 Event Tag
Now that we have our custom JavaScript variable that captures the page loading time and our trigger, it’s time to create our GA4 event tag. This tag will send the loading time to Google Analytics.
- Event Name:
page_load_time - Parameter Name:
loading_time_sec - Parameter Value:
{{Page Load Time}}
Here’s an example of what the tag will look like:
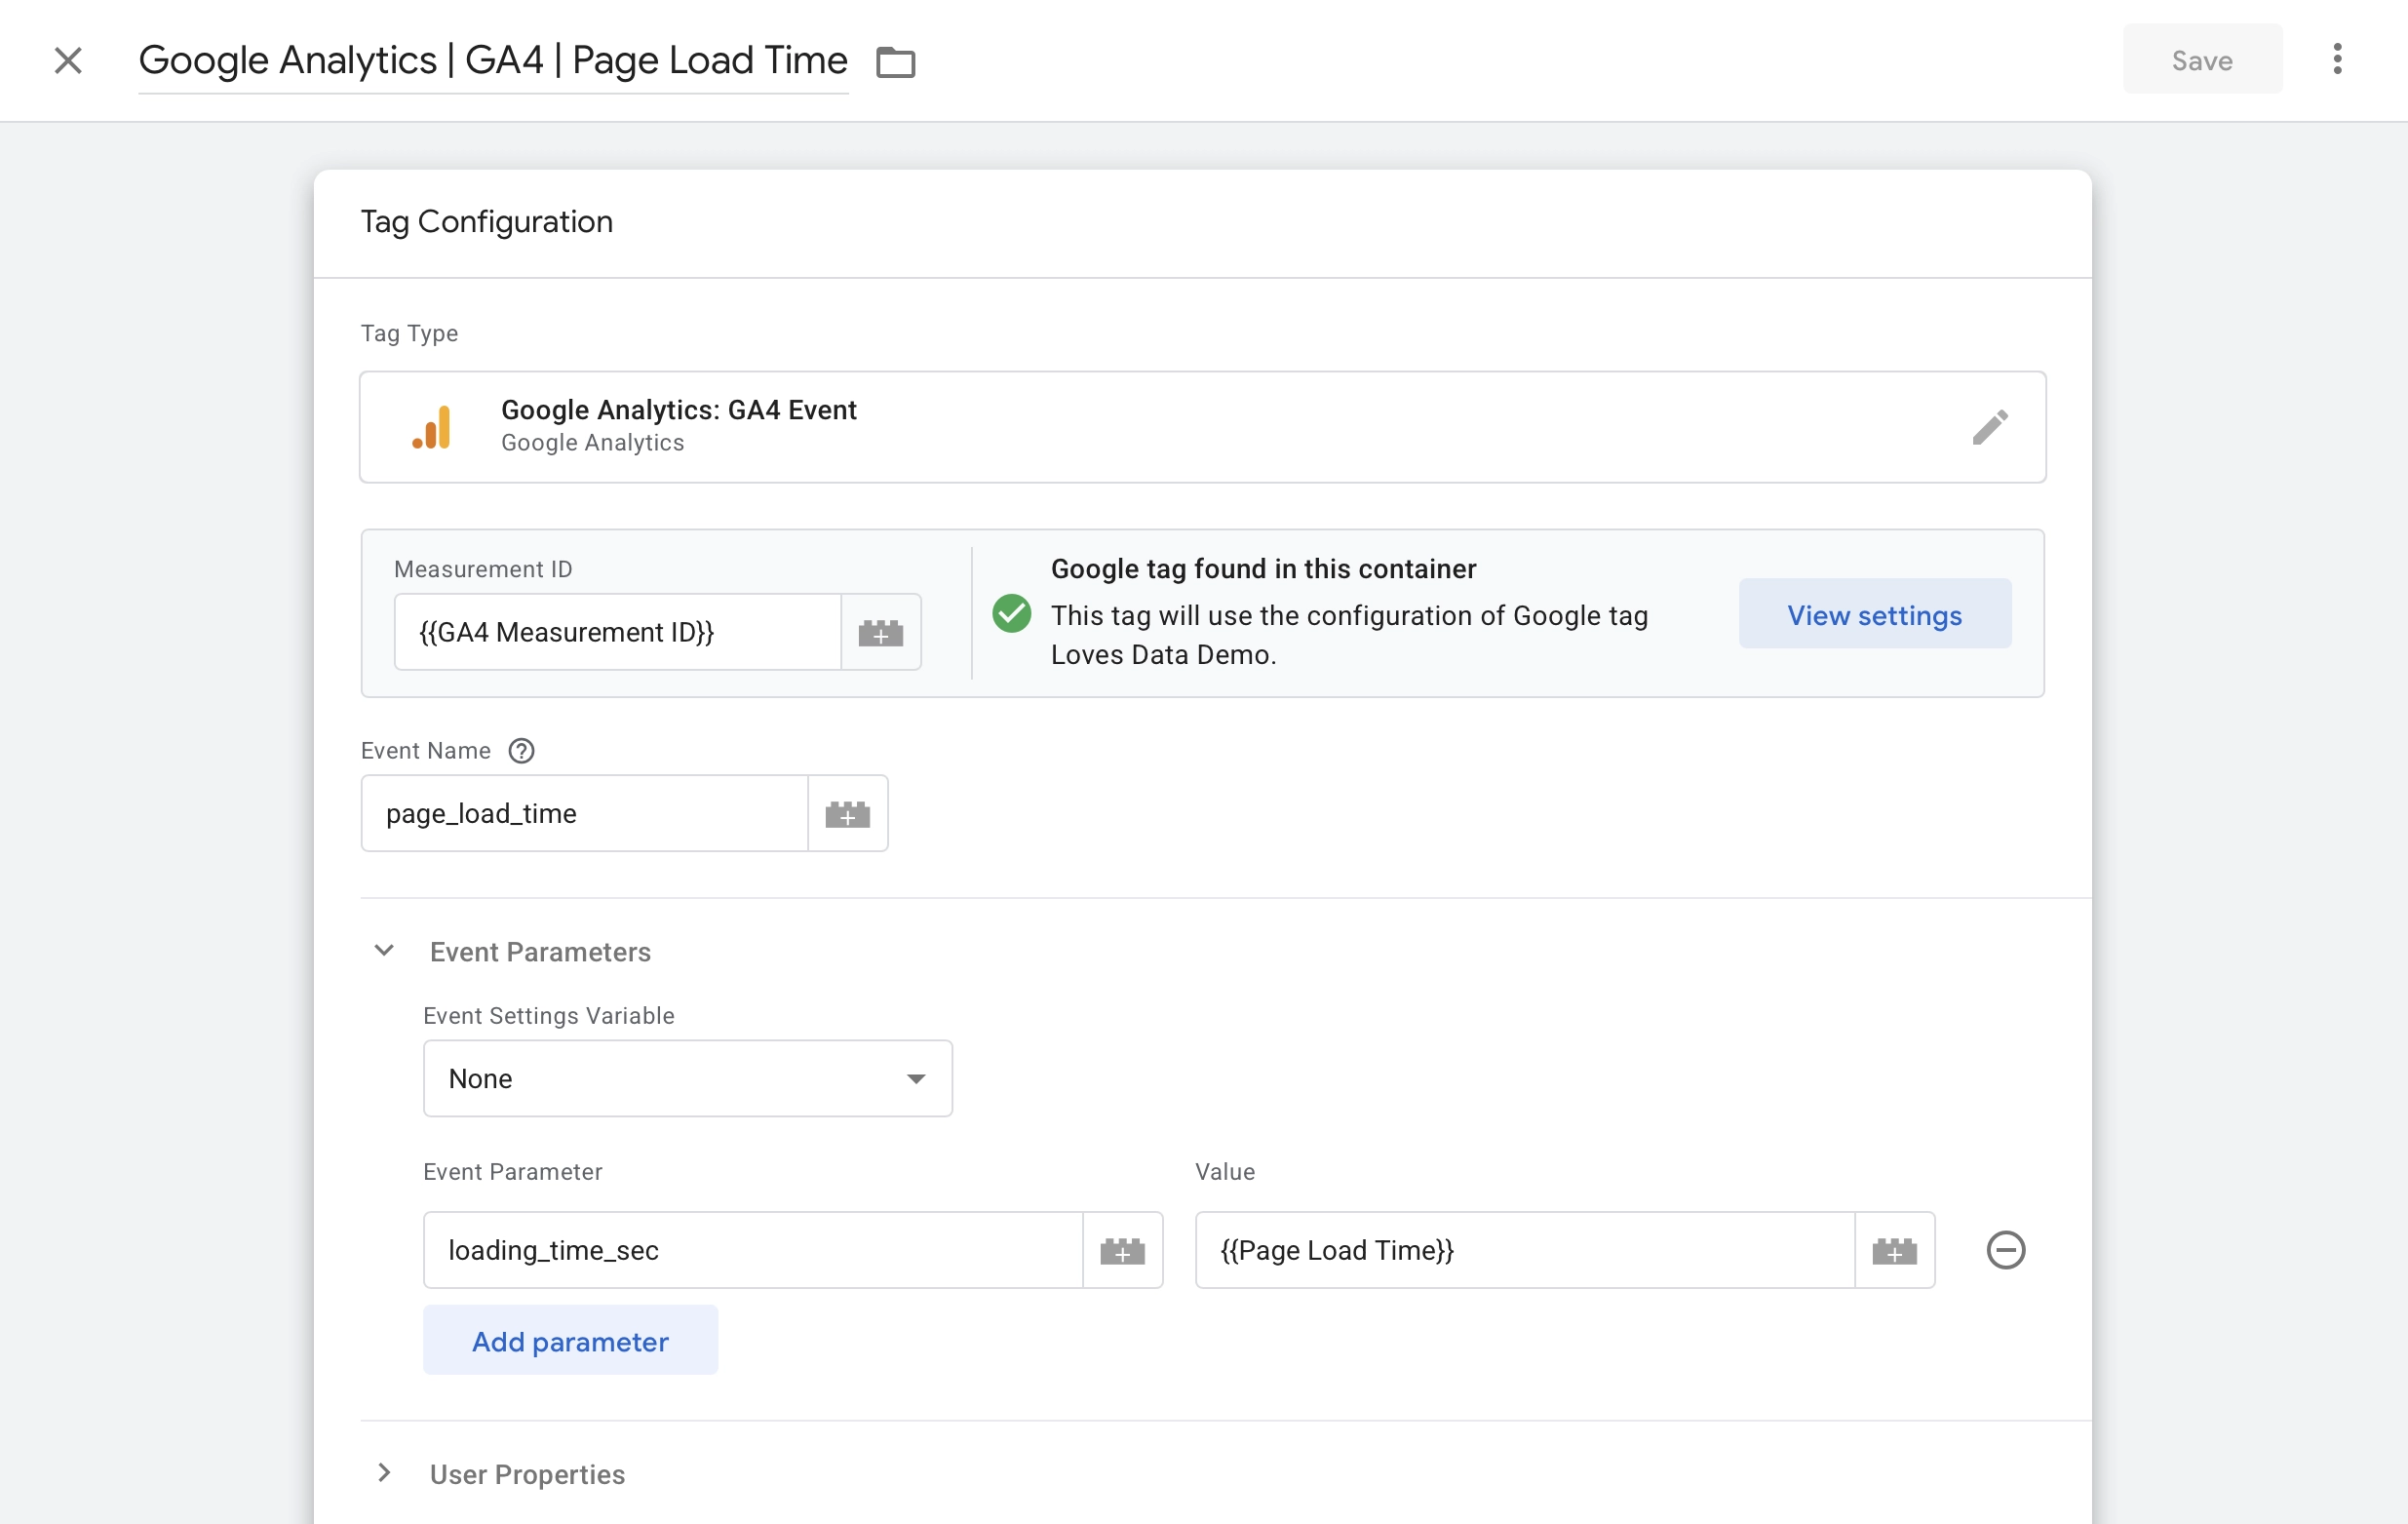
I’ve opted to name the event page_load_time, but you can name your event anything you like. I’m also sending the page load time (in seconds) to Google Analytics using the loading_time_sec parameter.
Step 4: Create a Custom Metric
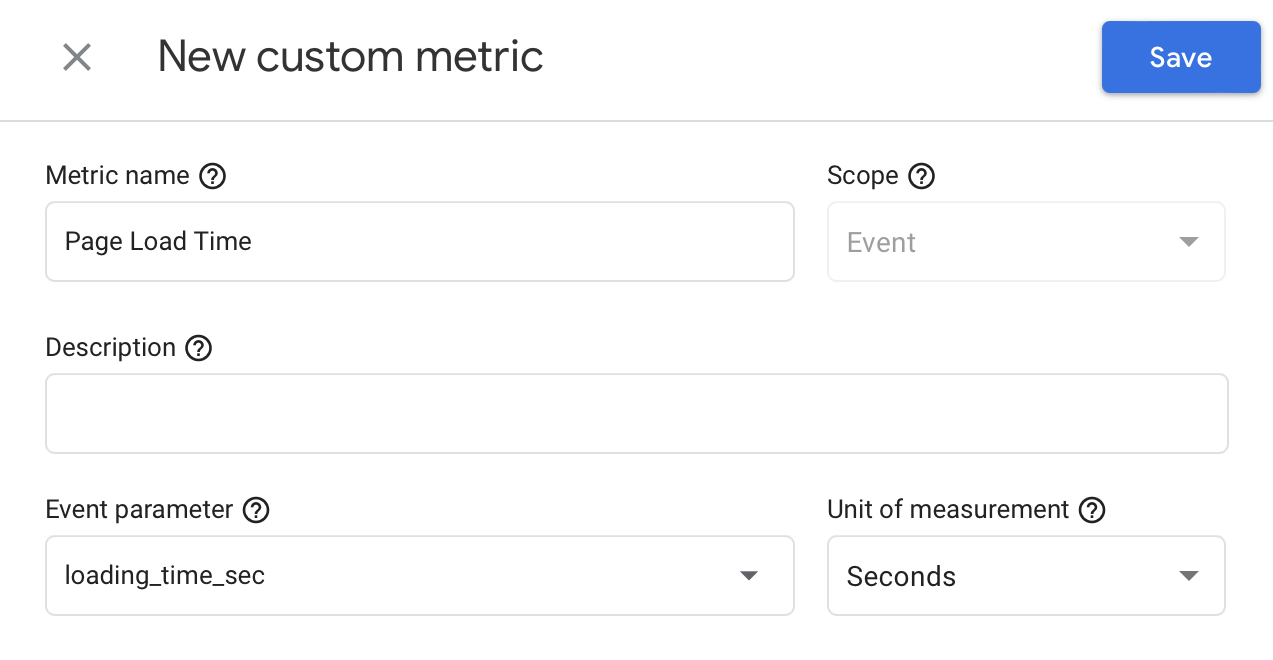
Now that we’ve created our custom page_load_time event, we need to register our loading_time_sec parameter in GA4 as a custom metric. To do this, you’ll need editor or administrator permission for the Google Analytics property.
In Google Analytics, you need to navigate to ‘Admin’, then ‘Data Display', select ‘Custom Definitions’, and choose the ‘Custom Metrics’ tab at the top. Now click 'Create Custom Metric' and configure the metric using the following:
- Metric Name: Page Load Time
- Scope: Event
- Description: (optional)
- Event Parameter:
loading_time_sec - Unit of Measurement: Seconds
Here’s what the configuration for your custom metric should look like:
Step 5: Create a Calculated Metric
Taking the time to create a calculated metric means you will be able to report on the average loading time for each of your pages in Google Analytics. If you choose to skip this step and just use the custom metric from the previous step, you will be able to report on total loading time for each page, but not the average. So it's worth creating a calculated metric too.
To create a calculated metric, make sure you're still in the 'Admin' area of Google Analytics. Select 'Data Display', then 'Custom Definitions', and this time choose the 'Calculated Metrics' tab at the top. You can then click 'Create Calculated Metric'.
- Name: Average Page Load Time
- API Name: (just leave the default)
- Description: (optional)
- Formula:
{Page Load Time}/{Event Count} - Unit of Measurement: Standard
Here's what the calculated metric should look like:
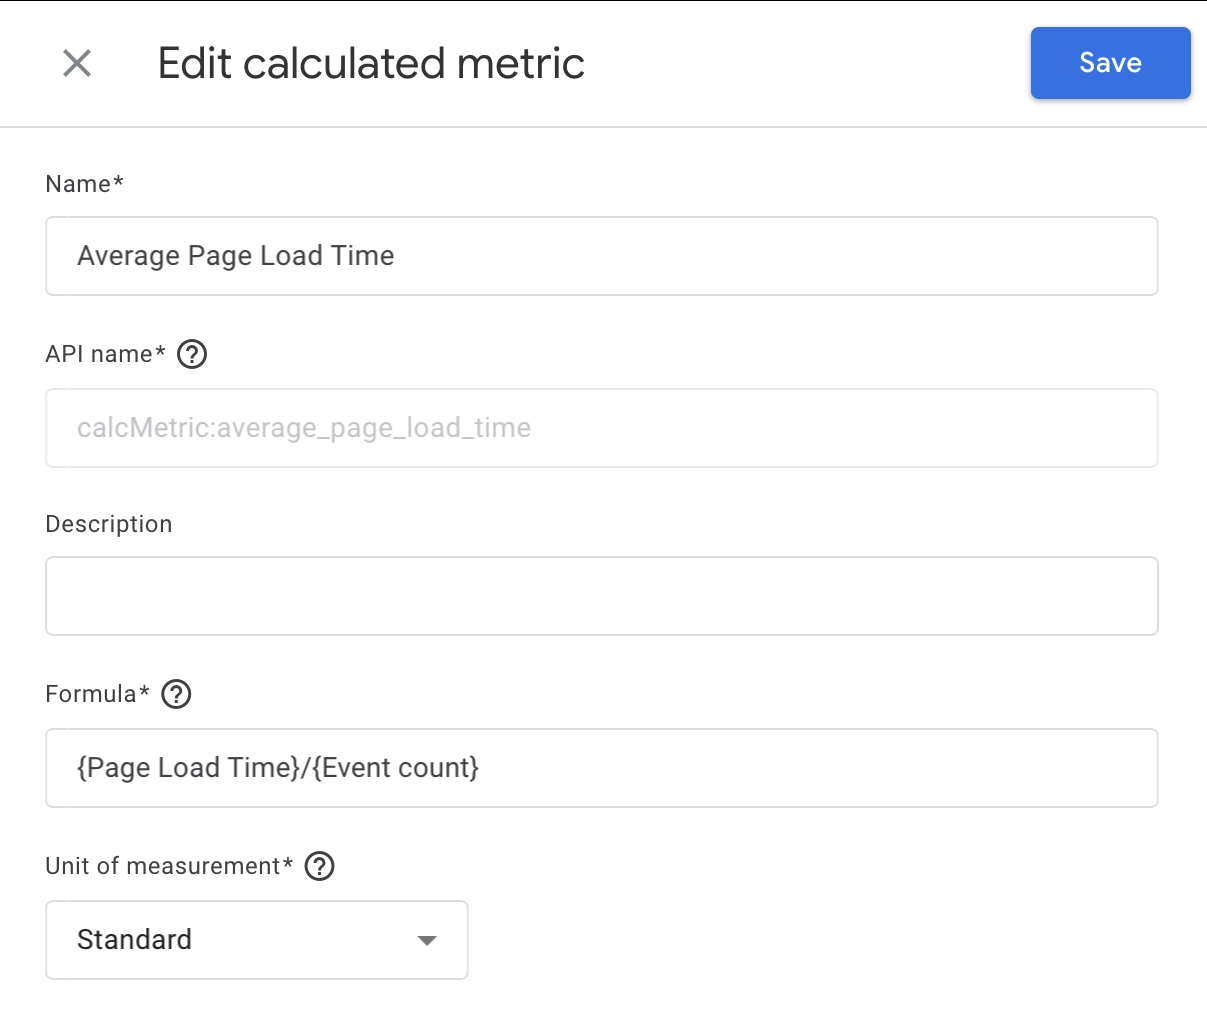
This metric will give you the average loading time per page view. For example, you can combine the metric with the 'Page Path' or 'Landing Page' dimension to compare the loading time of your pages.
Step 6: Test Your Tag and Publish
The final step is to test the tag, triggers, and variable in your GTM container. To do this, use Google Tag Assistant (Preview Mode) to confirm that the event fires correctly and the value appears for your tag.
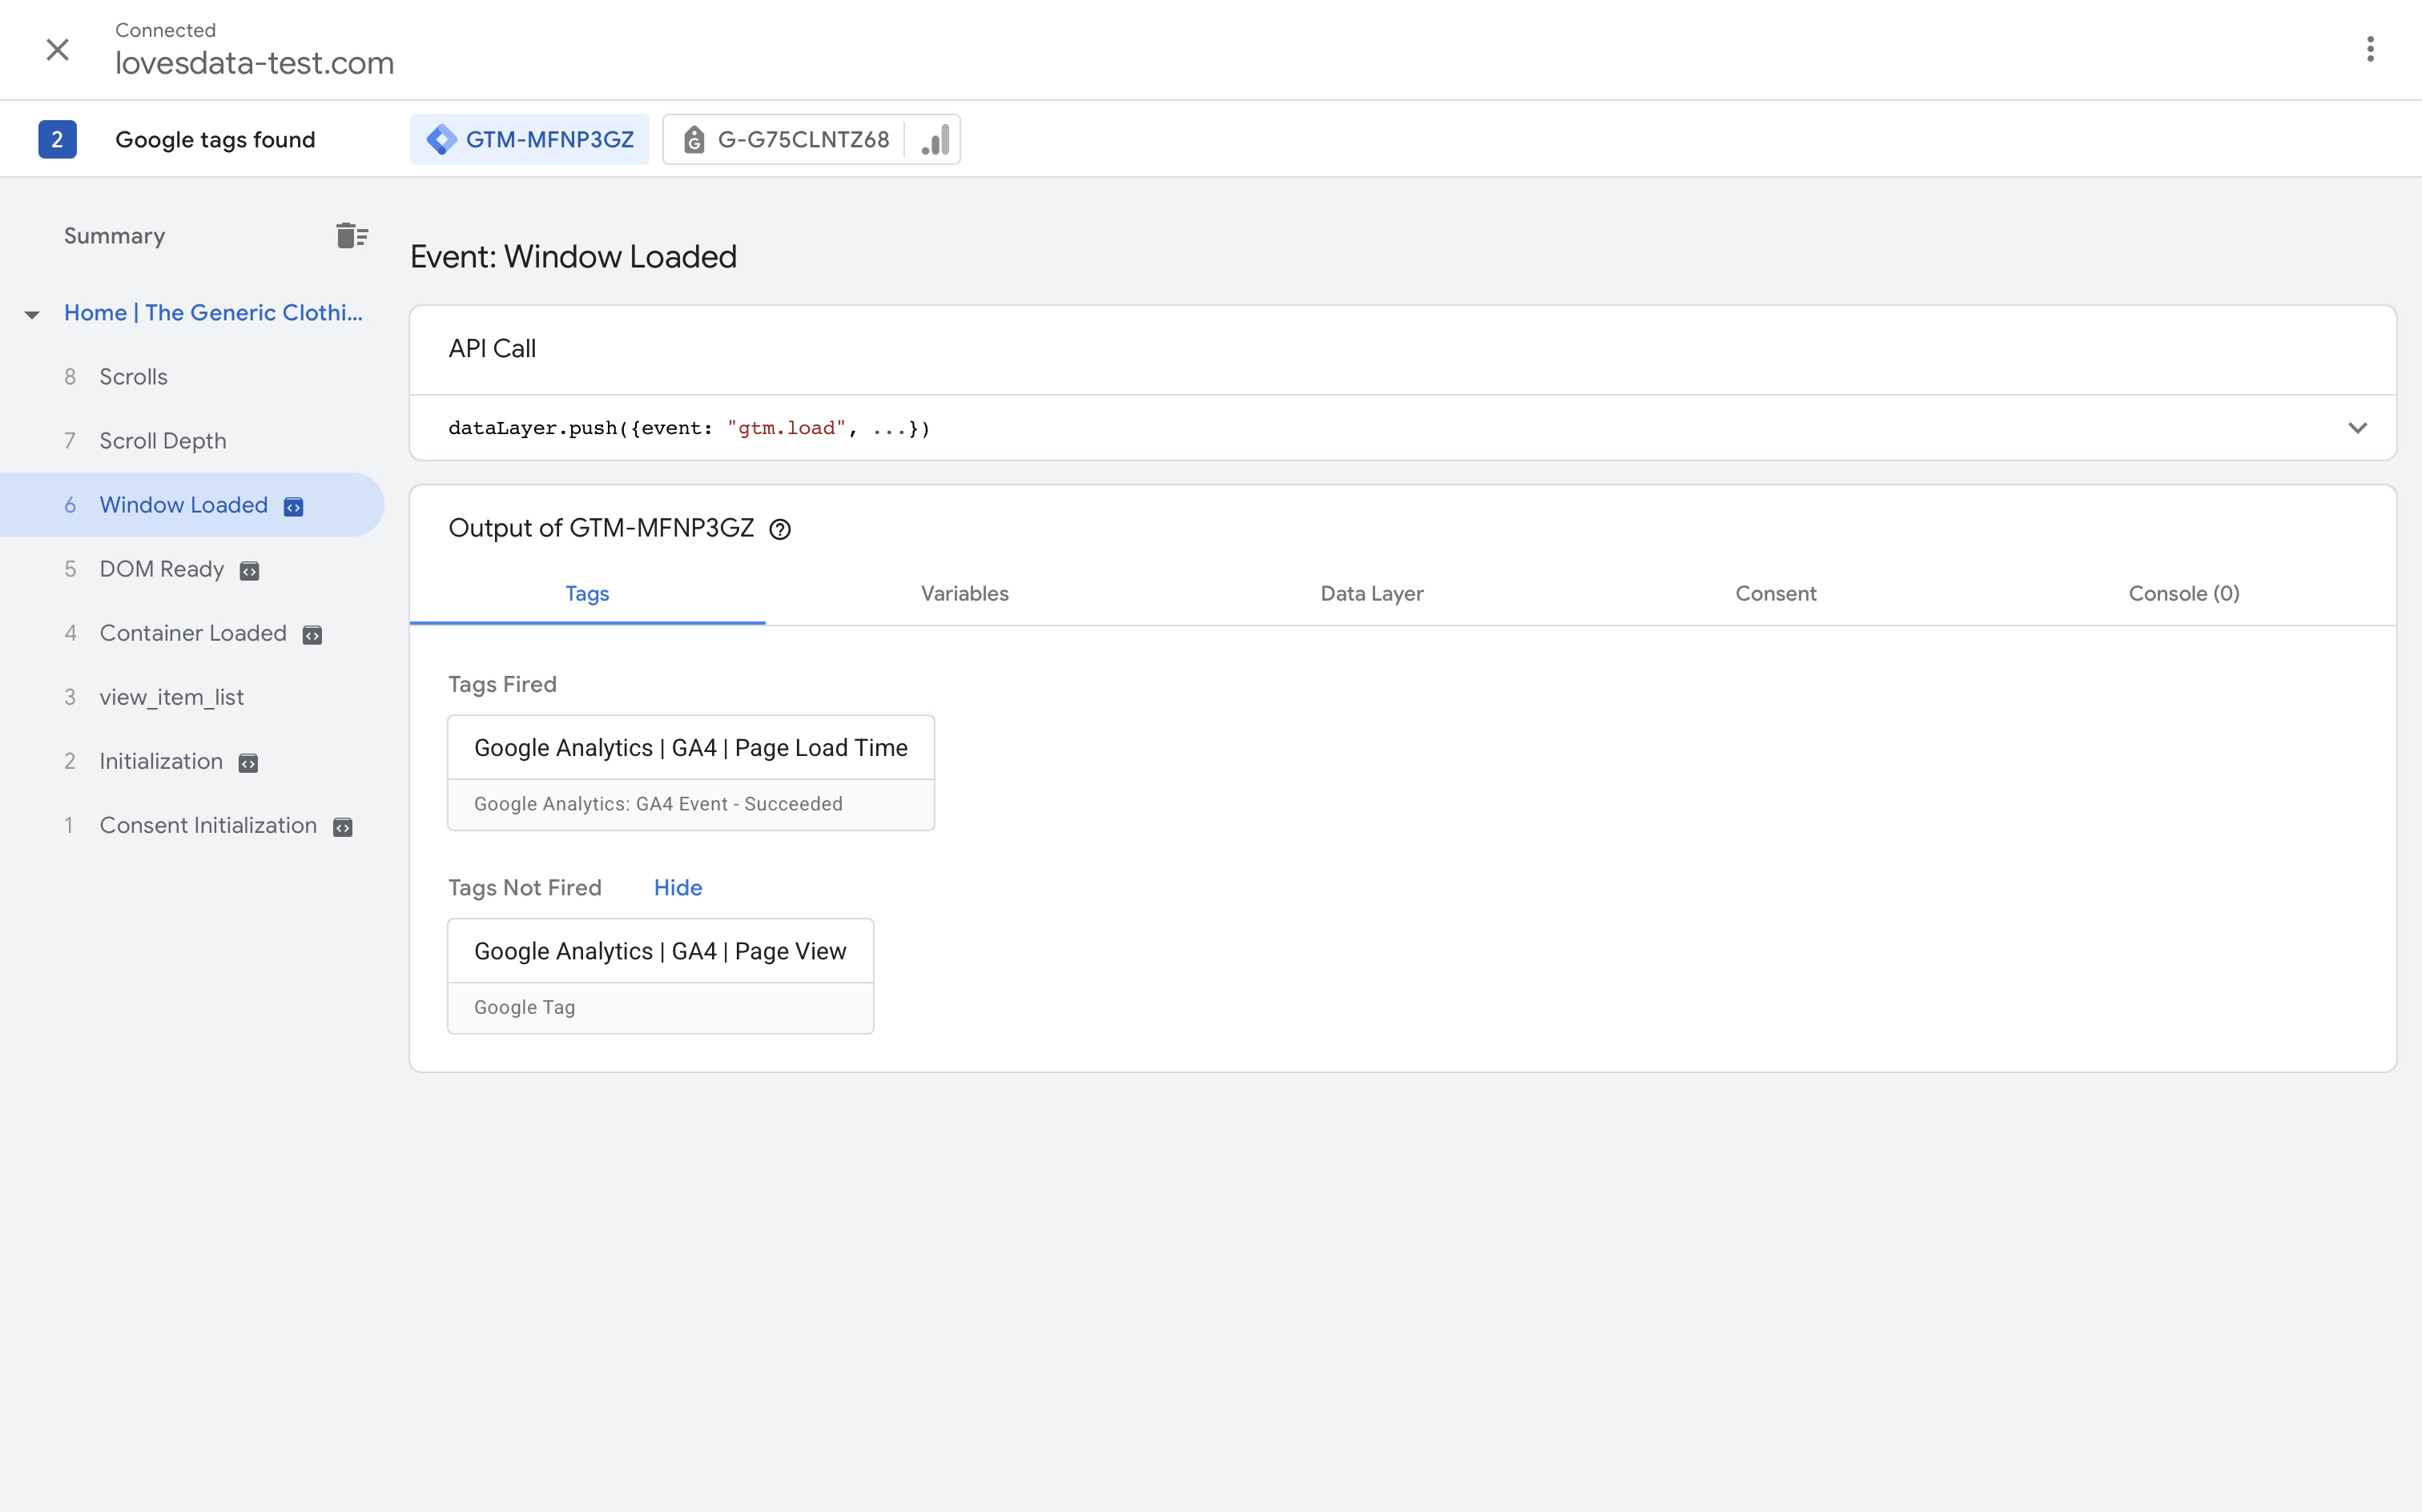
Then select the ‘Google Analytics | GA4 | Page Load Time’ tag.
You can select ‘Values’ on the top right corner to then see the value being collected by the parameter. Here’s an example of the page loading time value being sent to Google Analytics:
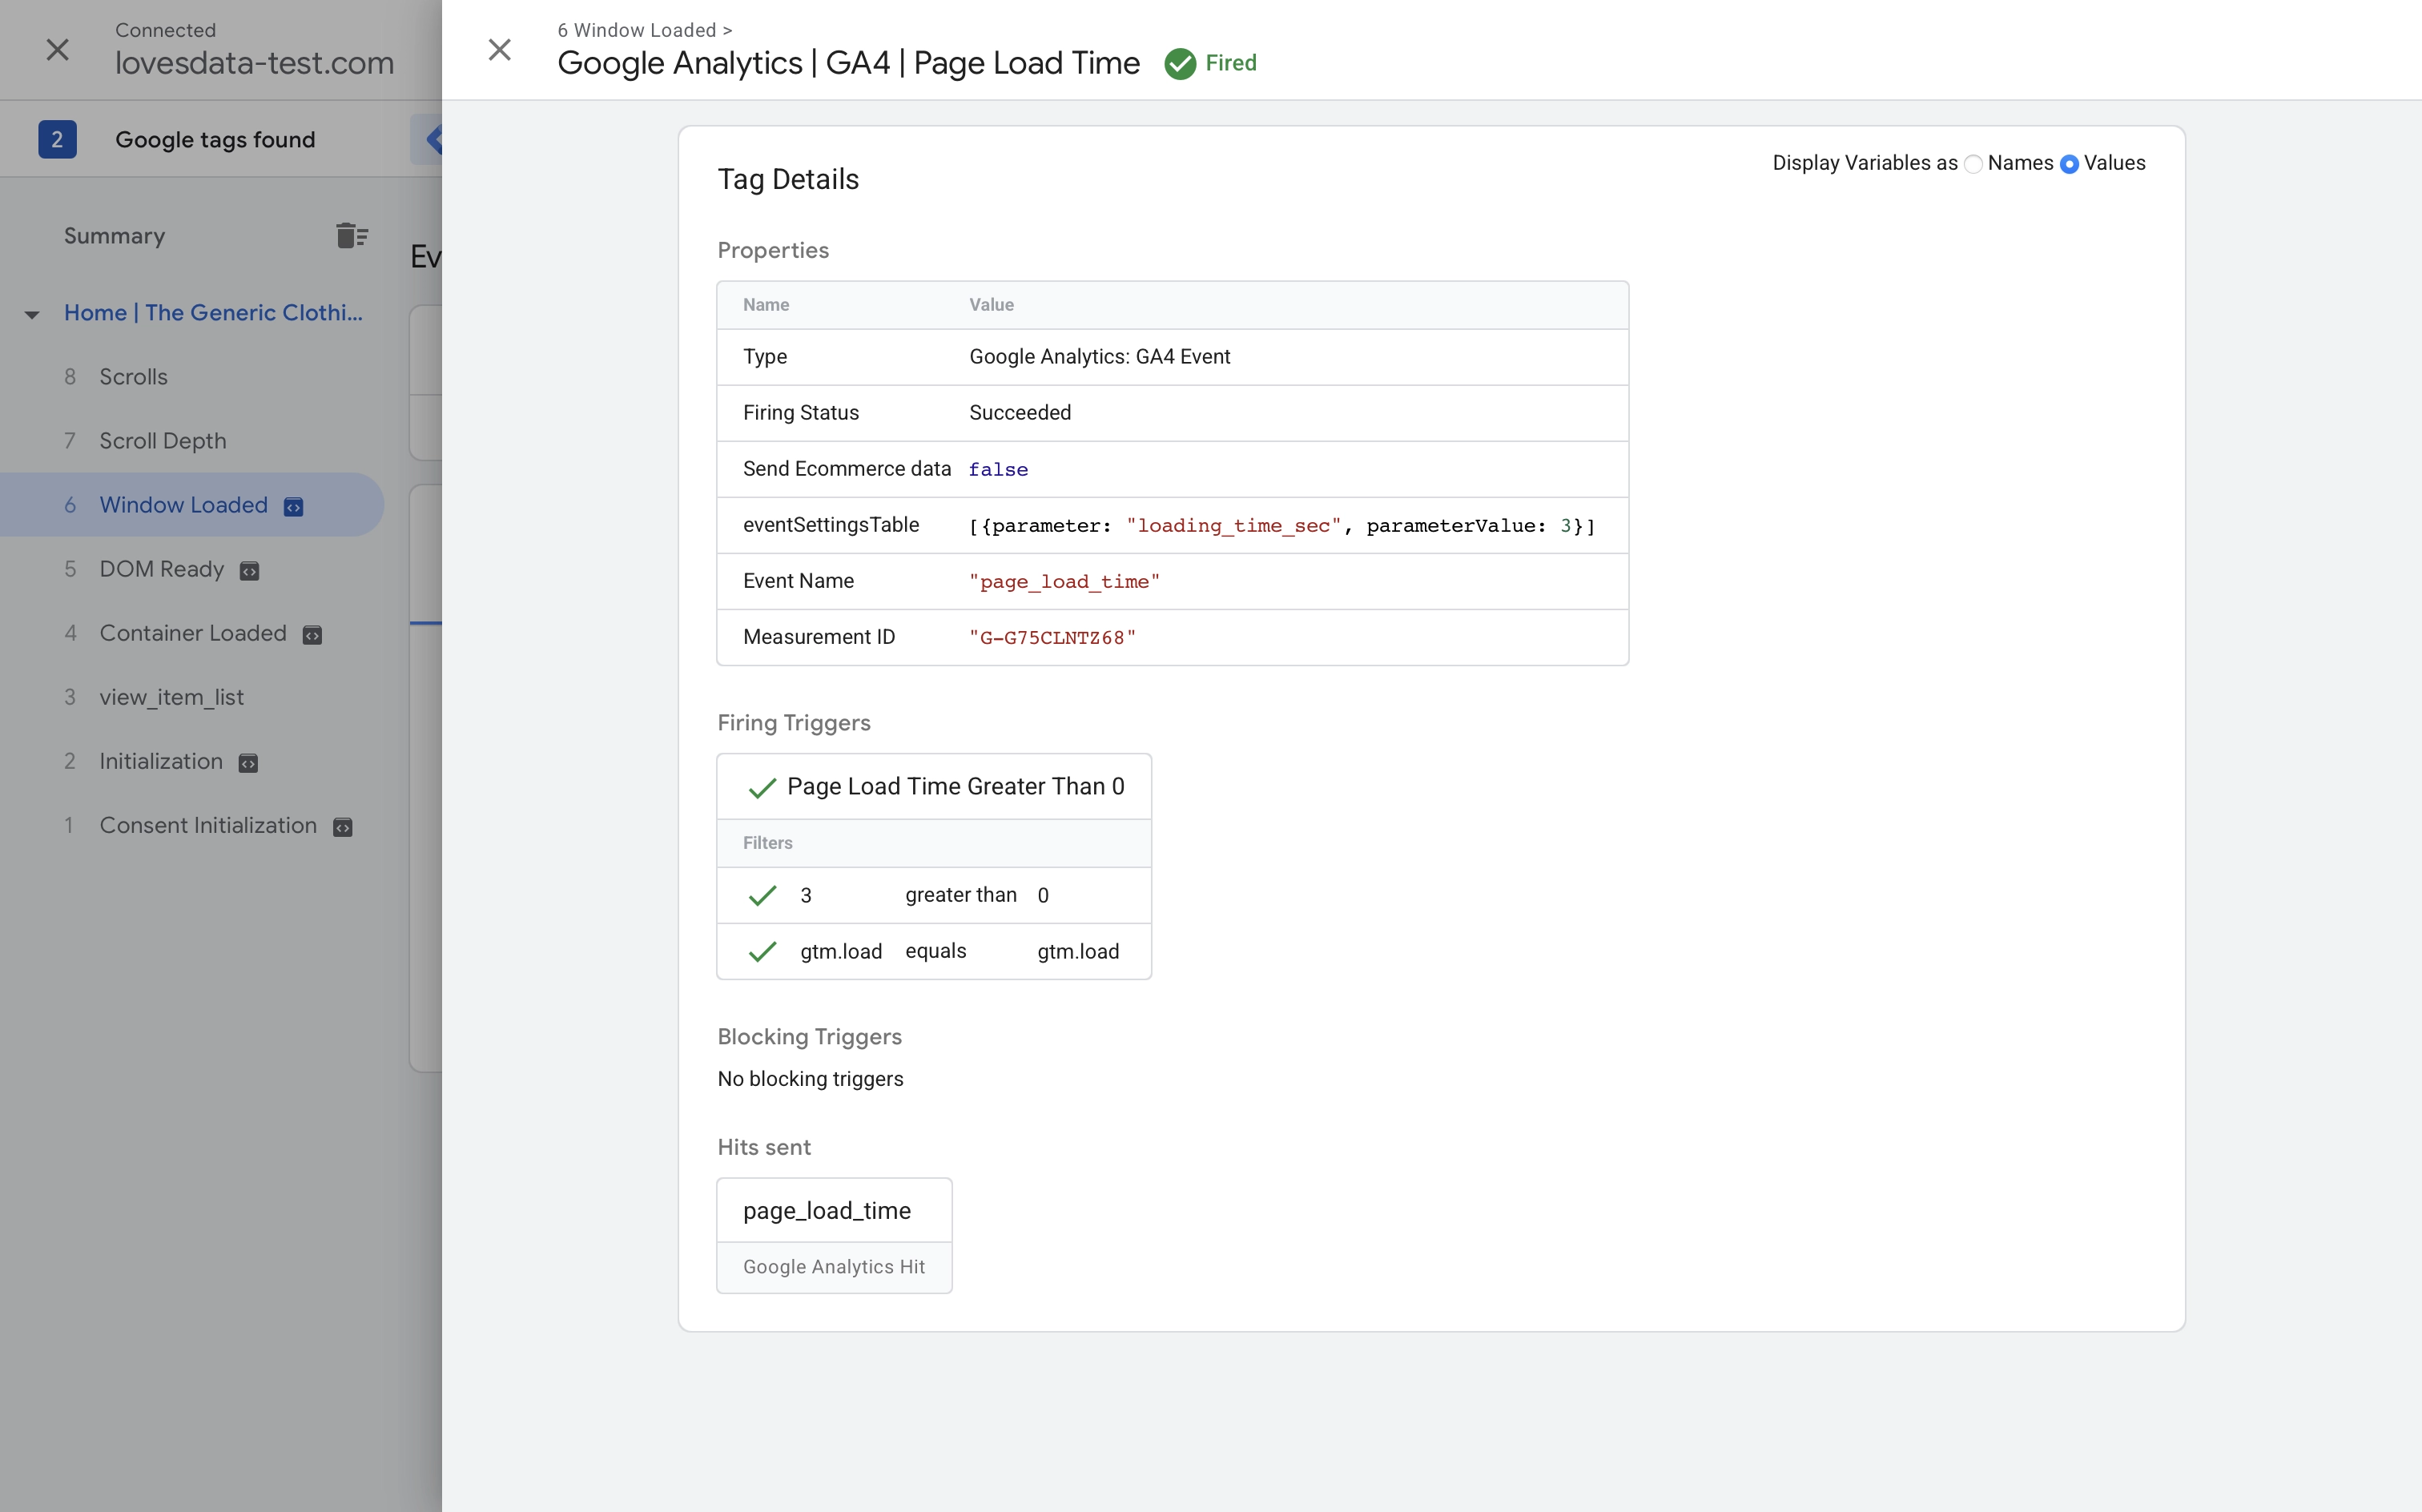
Once confirmed, publish your GTM container to start collecting data. You’ll now be tracking page loading time in GA4!
Troubleshooting Tips
Common reasons you might encounter issues tracking page load time with this solution include:
- Data is only collected once you’ve implemented the page load time tracking solution. You won’t see page load time for your historical data, so it’s a good idea to check the date range used for the report. Ensure the date range begins after you implemented page load time tracking.
- The page load time value isn’t appearing when previewing the container. Check that page load time is being collected correctly using Tag Assistant. If a value is unavailable in Tag Assistant, you will need to check the tag, trigger, and variable.
- Ensure the GTM container has been published. If it’s not published, then you will see the value in Tag Assistant (and the DebugView in GA4), but you won’t be collecting data in your reports.
- Check if you’re using a CSP (Content Security Policy) on your website. If you are, this solution might not work. You can find more details in Google’s developer documentation.
- This solution doesn’t work with Single Page Applications (SPAs). For SPAs, consider using PerformanceObserver and listen for route changes.
Reporting on Page Load Time
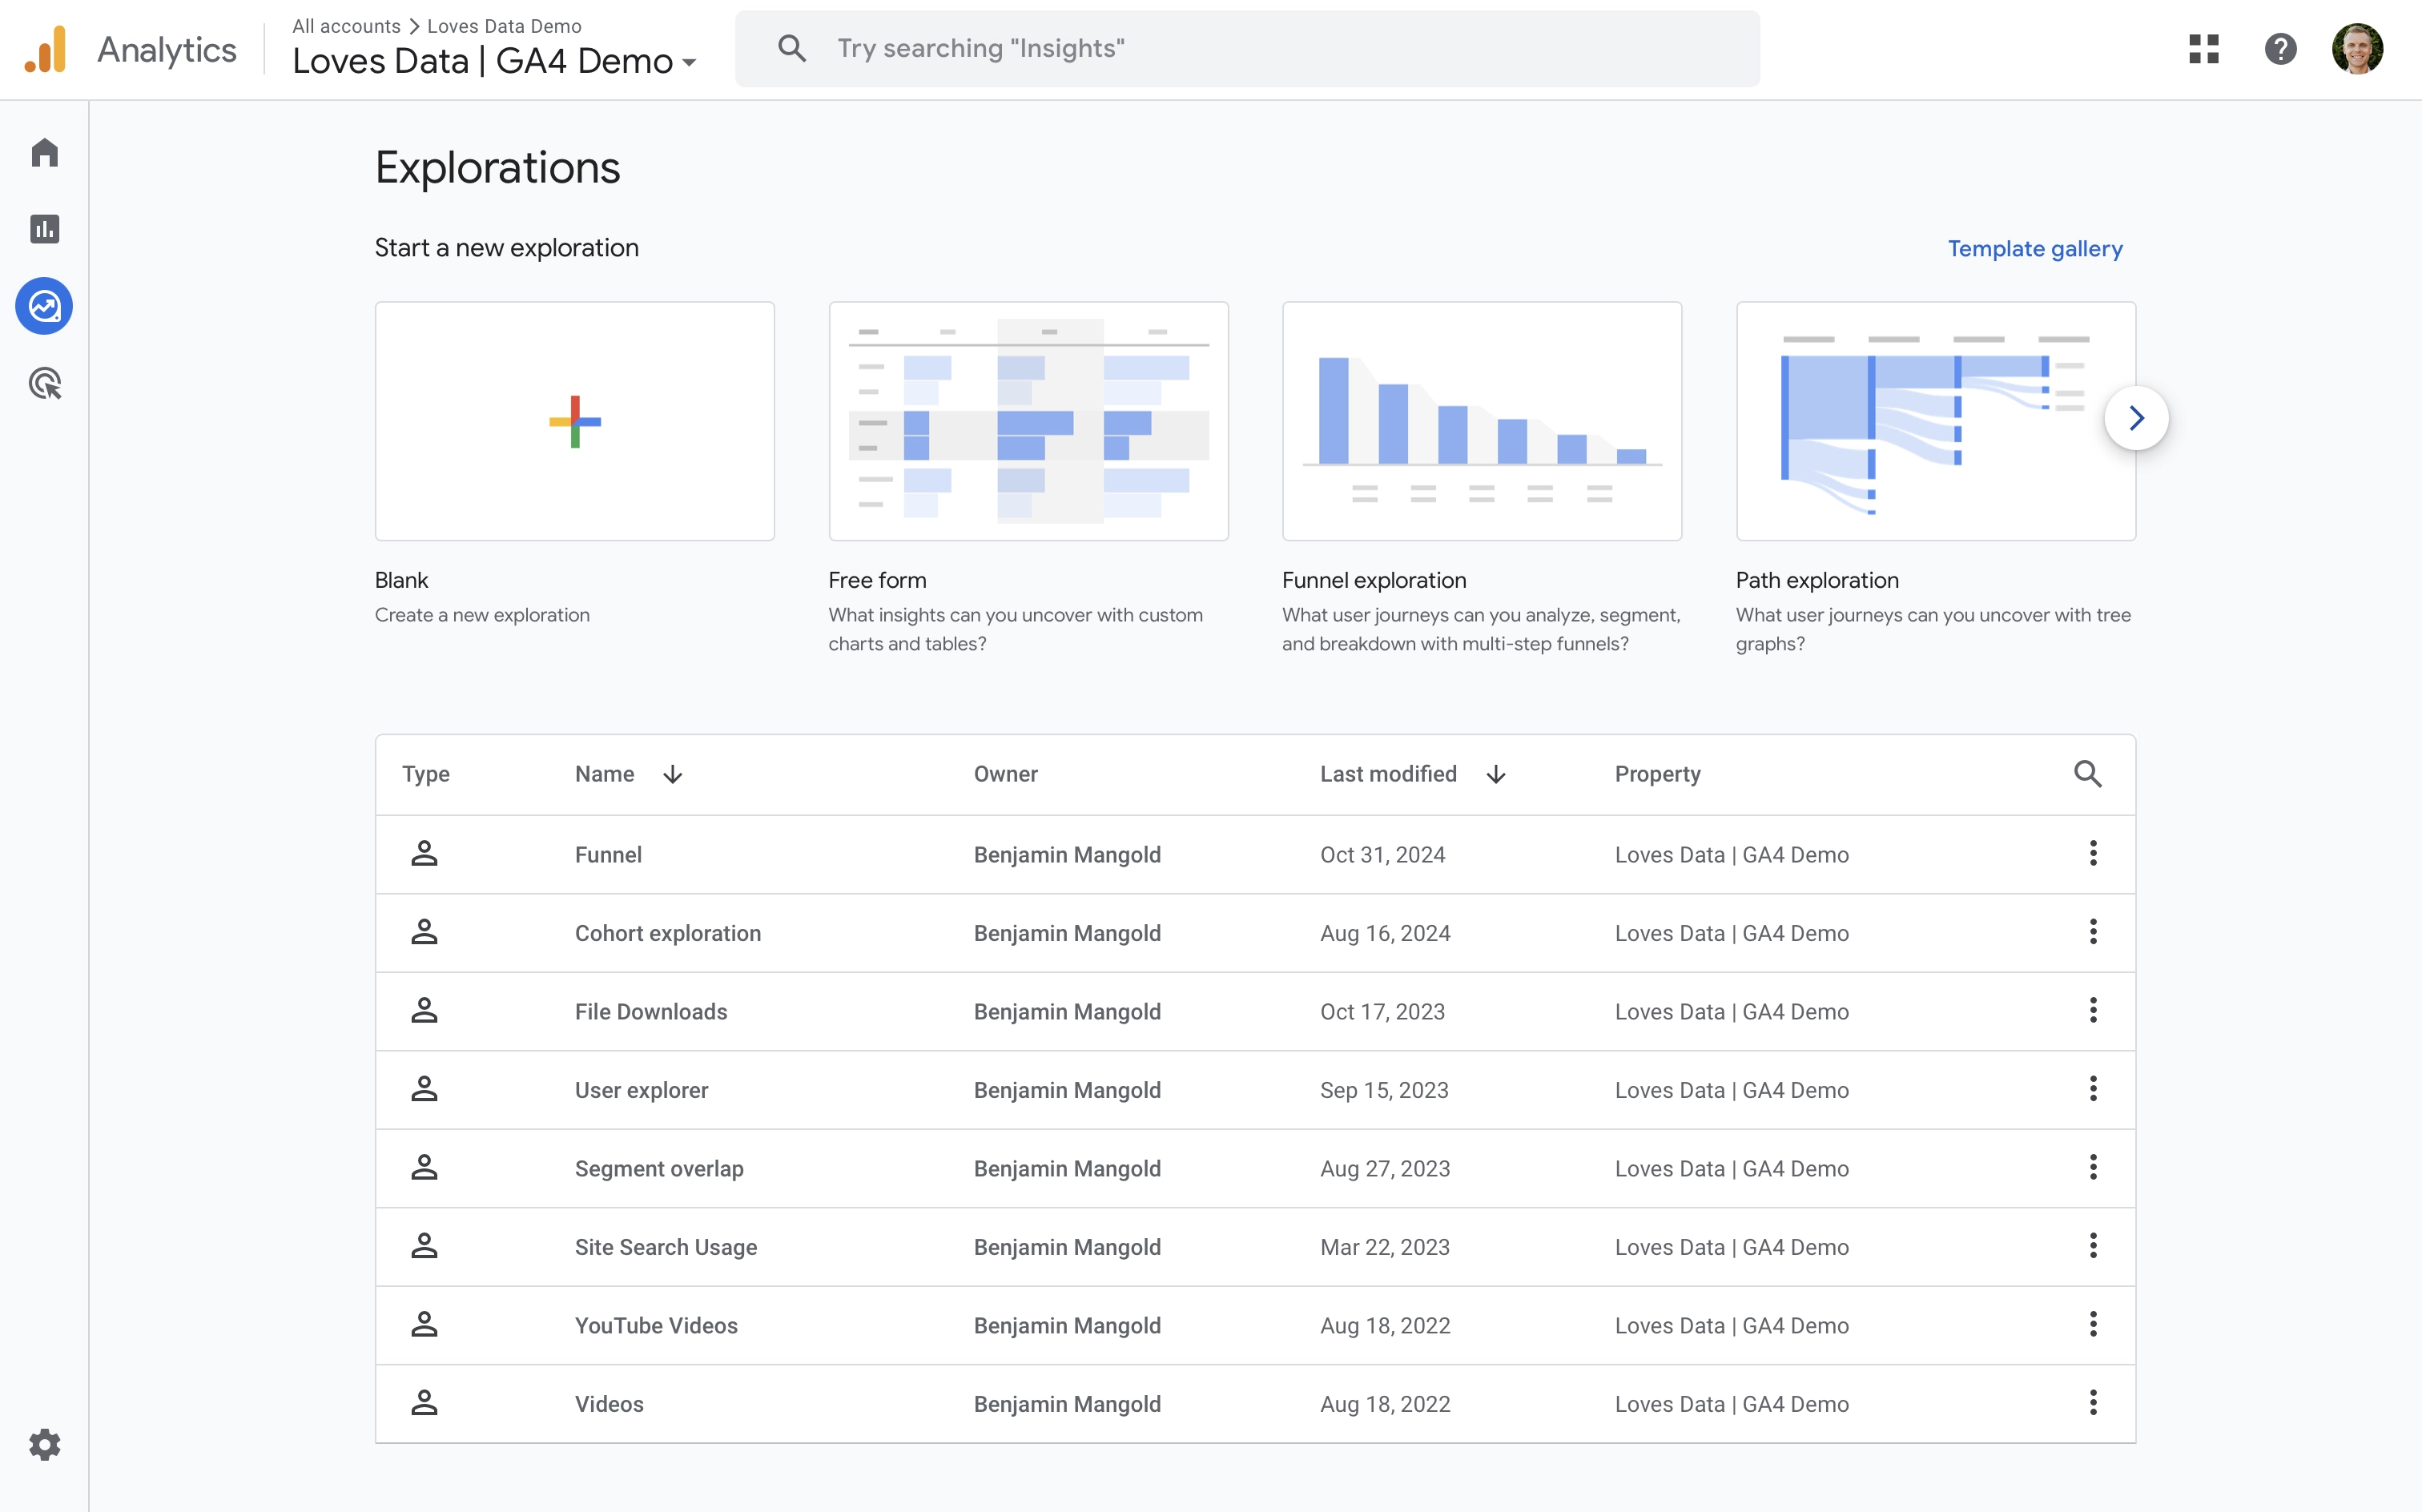
Once you’re collecting page loading times into Google Analytics, the next step is to report on the performance of your pages. You can do this by creating a custom Exploration report and adding the custom and calculated metrics we've created. To do this, navigate to ‘Explore’ and create a new blank report.
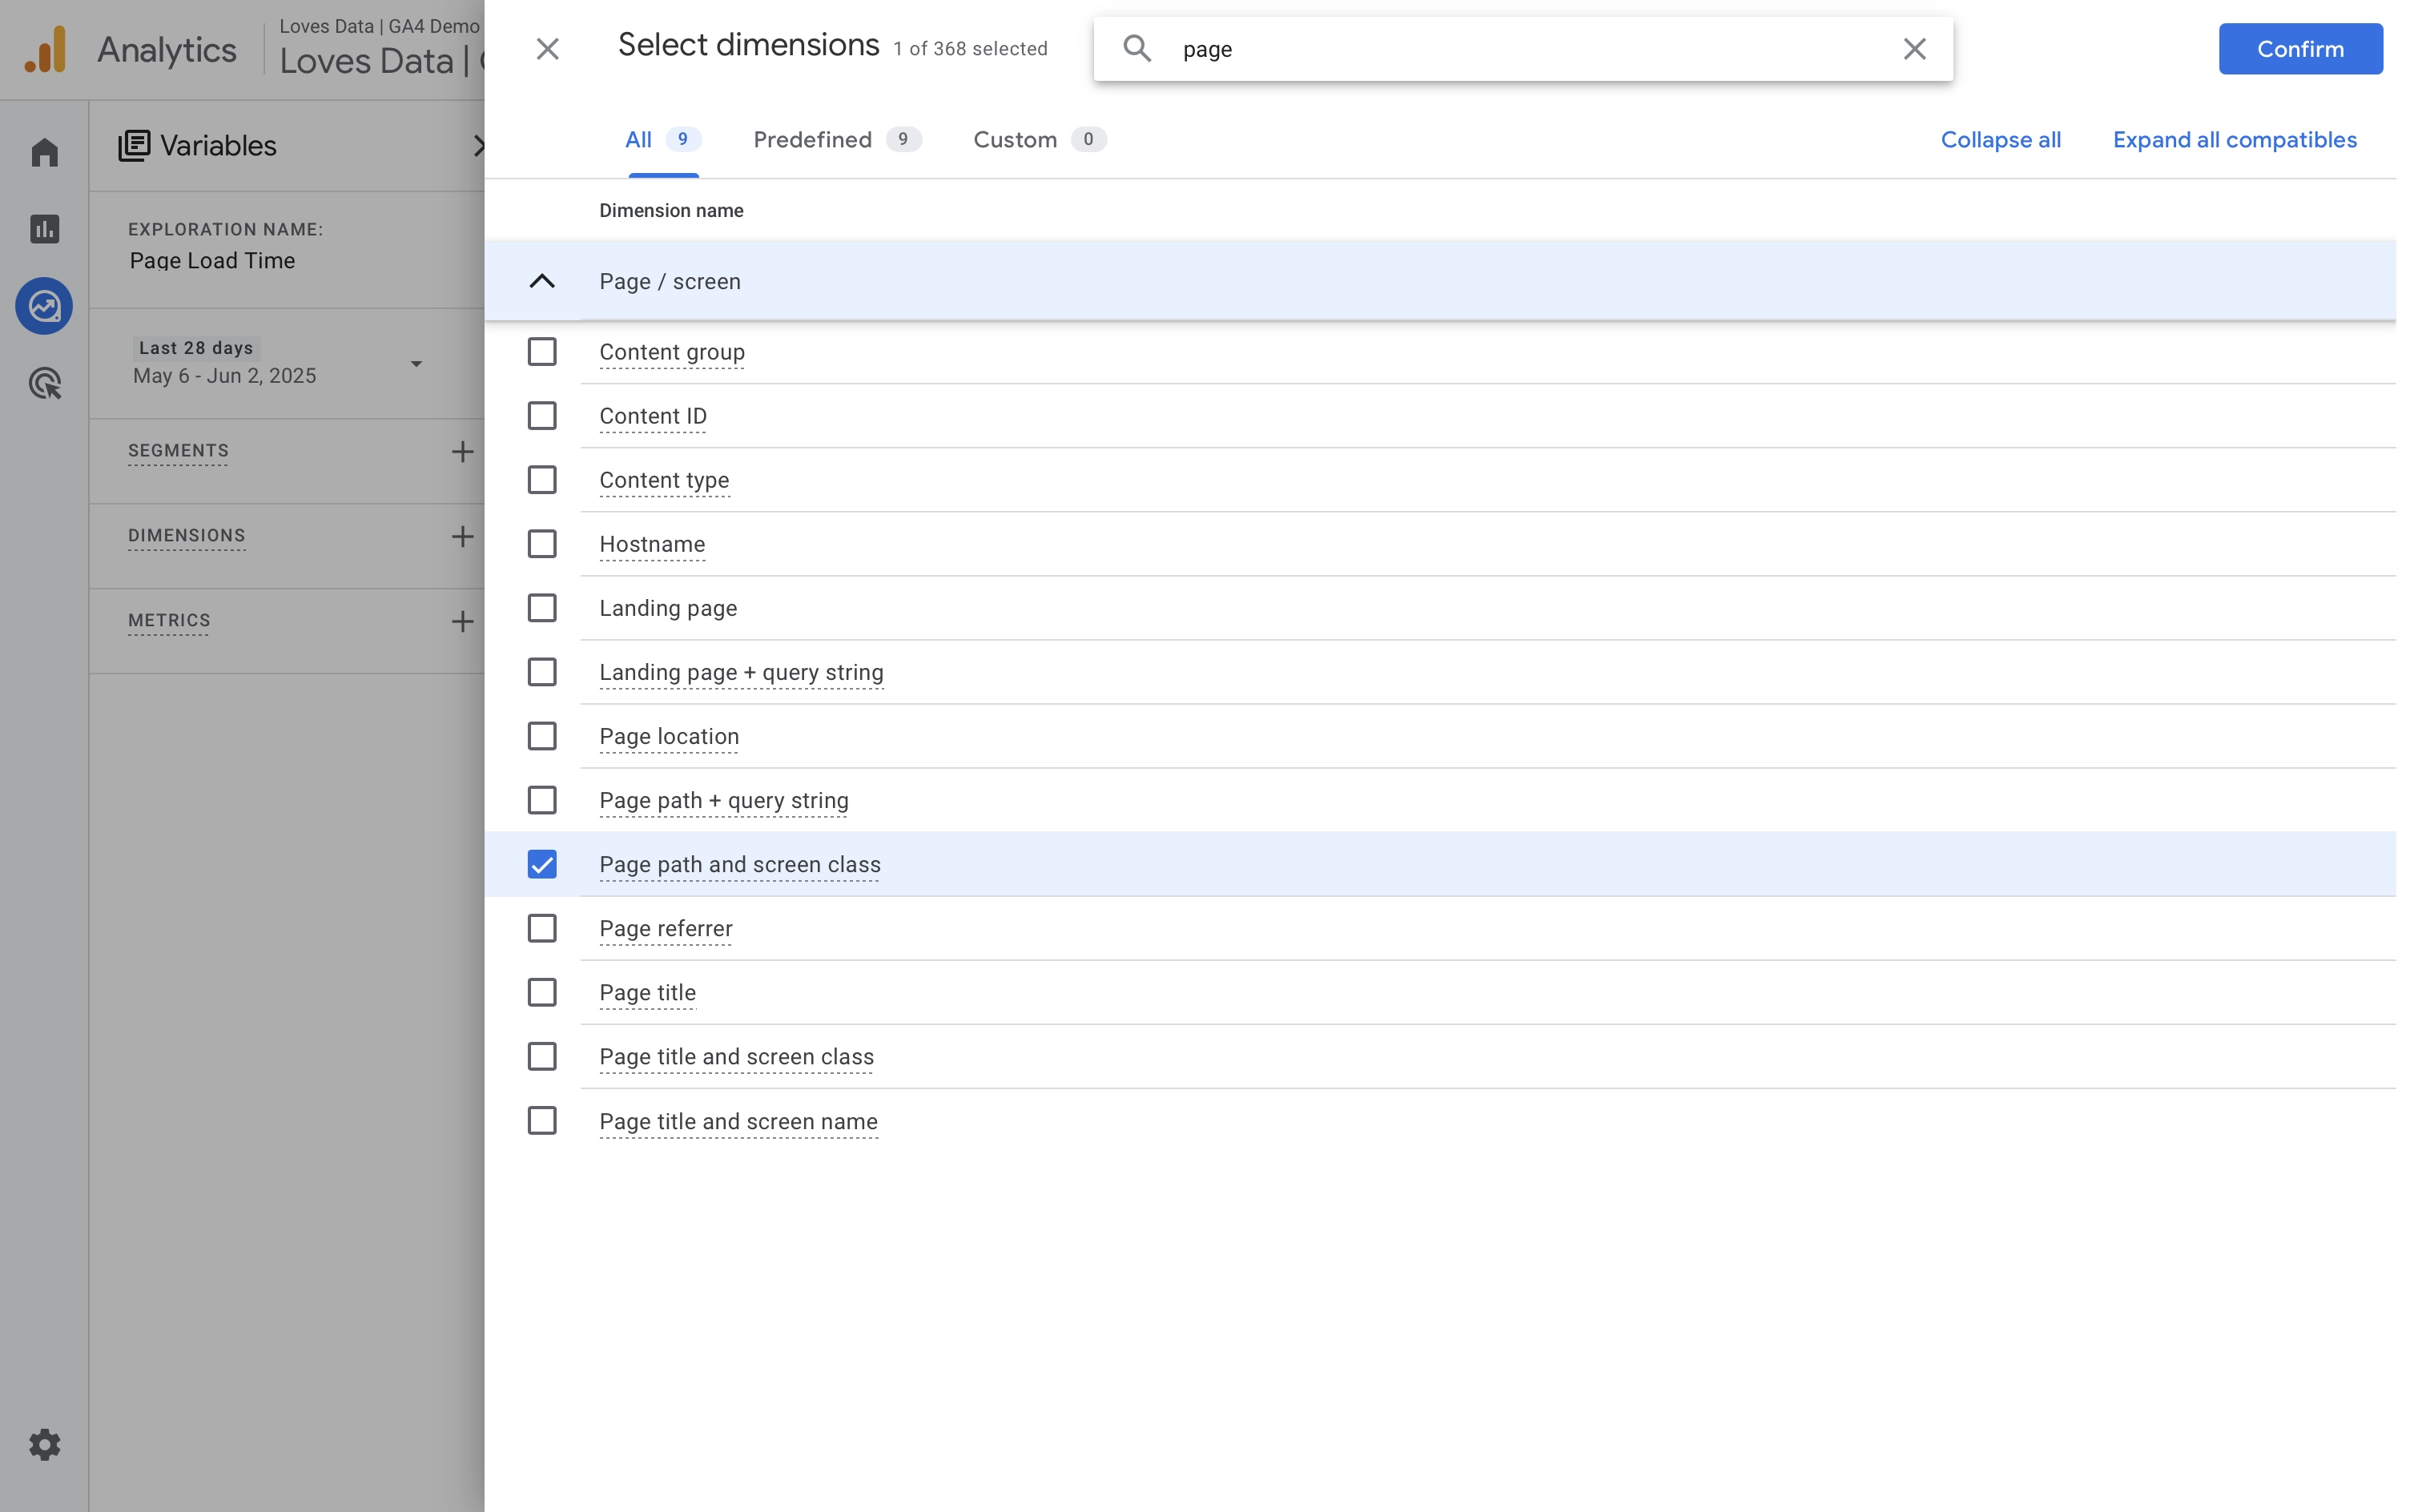
I’m going to add the ‘Page Path and Screen Class’ dimension to my report, but you can use any of the page-based dimensions you like. For example, you could also use ‘Page Location’, ‘Page Title’, or ‘Landing Page’ as the dimension.
We're also going to add the 'Event Name' dimension to the report. We will use this in a moment to filter our Exploration report to only include our page_load_time event.
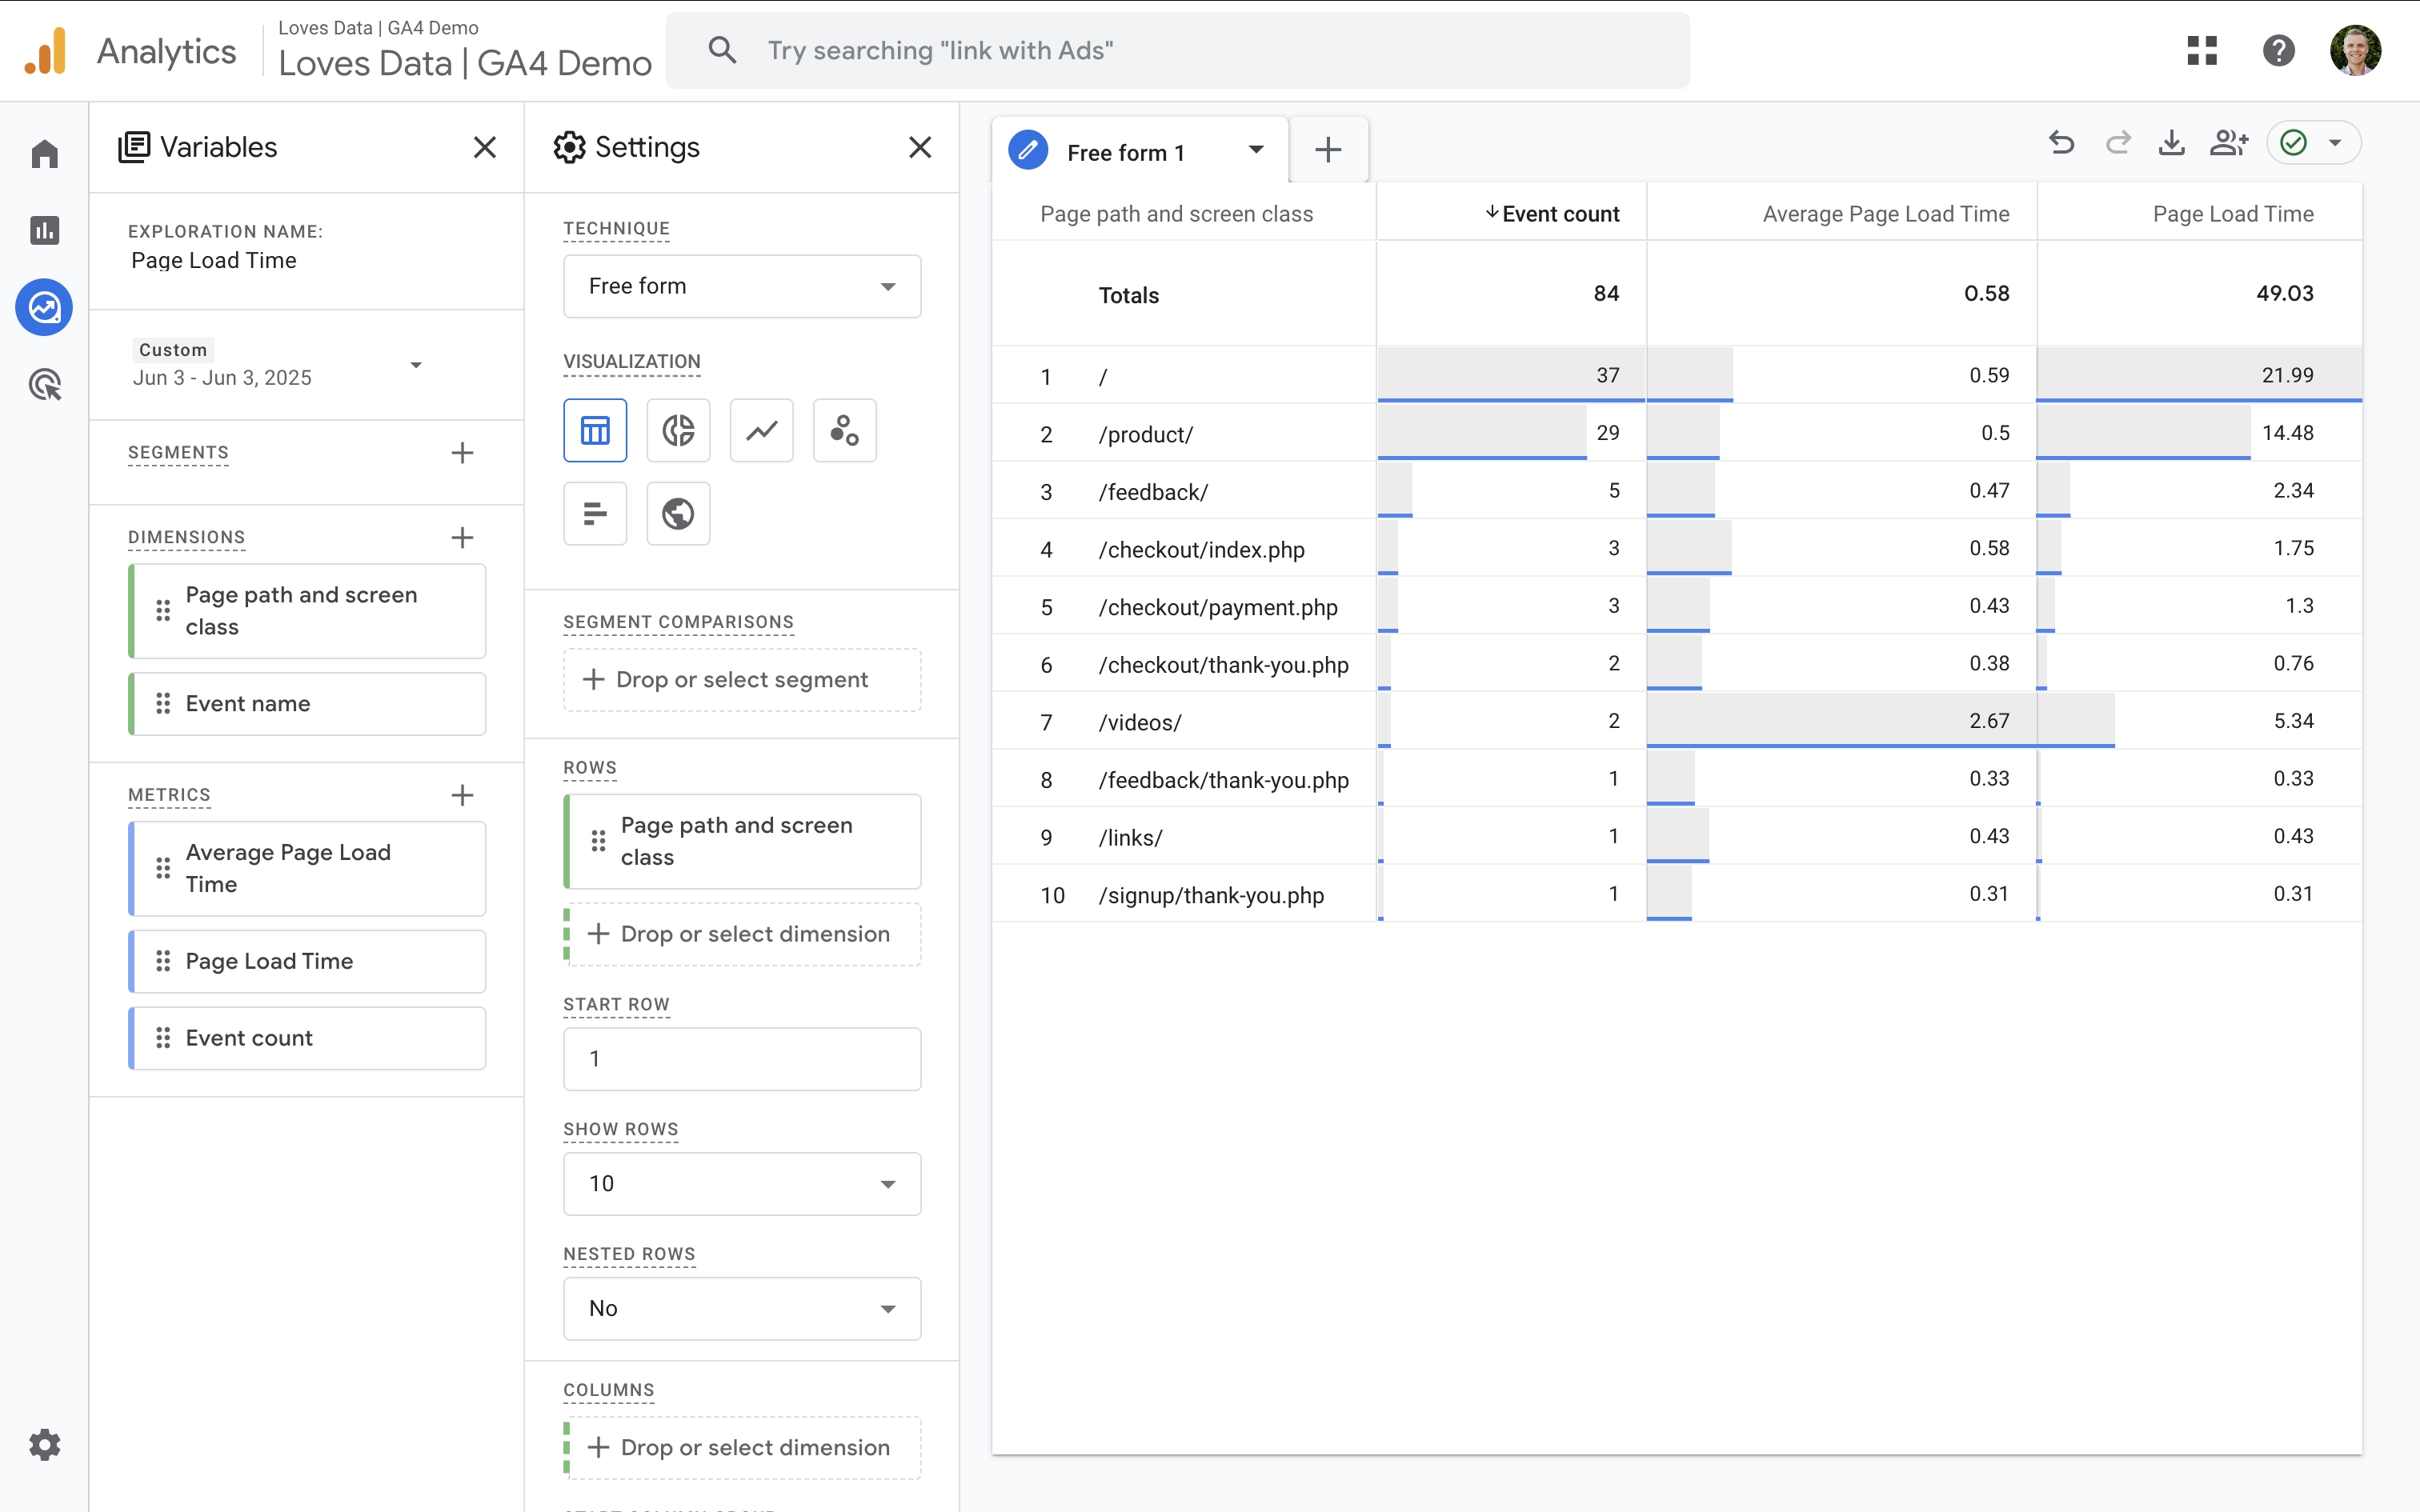
Next, I’m going to add the ‘Event Count’ metric and the custom 'Average Page Load Time' and ‘Page Load Time’ metrics to the report.
page_load_time. This ensures that we only count pages where the loading time has been collected. If we don't do this, then we will be skewing the 'Average Page Load Time' metric down, which wouldn't be accurate. Here's what the filter should look like: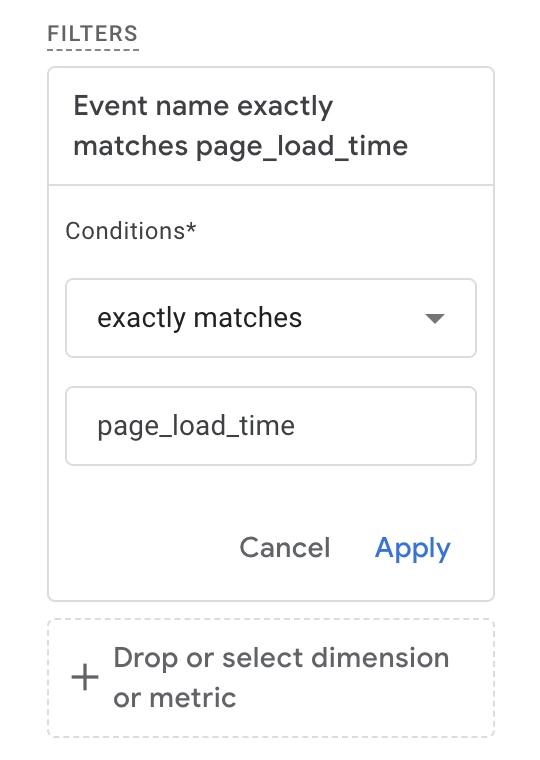
We're now reporting on the loading time for each of the pages on our website. You can also add add the metrics to standard reports, however, this won't provide accurate data by default. This is because the calculated metric divides the total loading time by the total number of events. Since you will be collecting more than just page_view and page_load_time events into Google Analytics, this means your 'Average Page Load Time' metric will be skewed lower and generally, much lower than what it really is.
If you want your loading time metrics in the standard reports you will need to send an additional parameter to Google Analytics. For example, with your page_load_time event, you could send another parameter called page_load_time_metric along with a hard-coded value of 1. Then by registering this as another custom metric in Google Analytics, you could adjust the calculated metric to use this for accurate reporting.
Would you like me to cover this in more detail? Please let me know in the comments.
Apart from the options we've covered, using Looker Studio is a great way to create custom dashboards and reports to include your page load time metrics. Let's take a look at this option now.
Using Looker Studio to Report Page Load Time
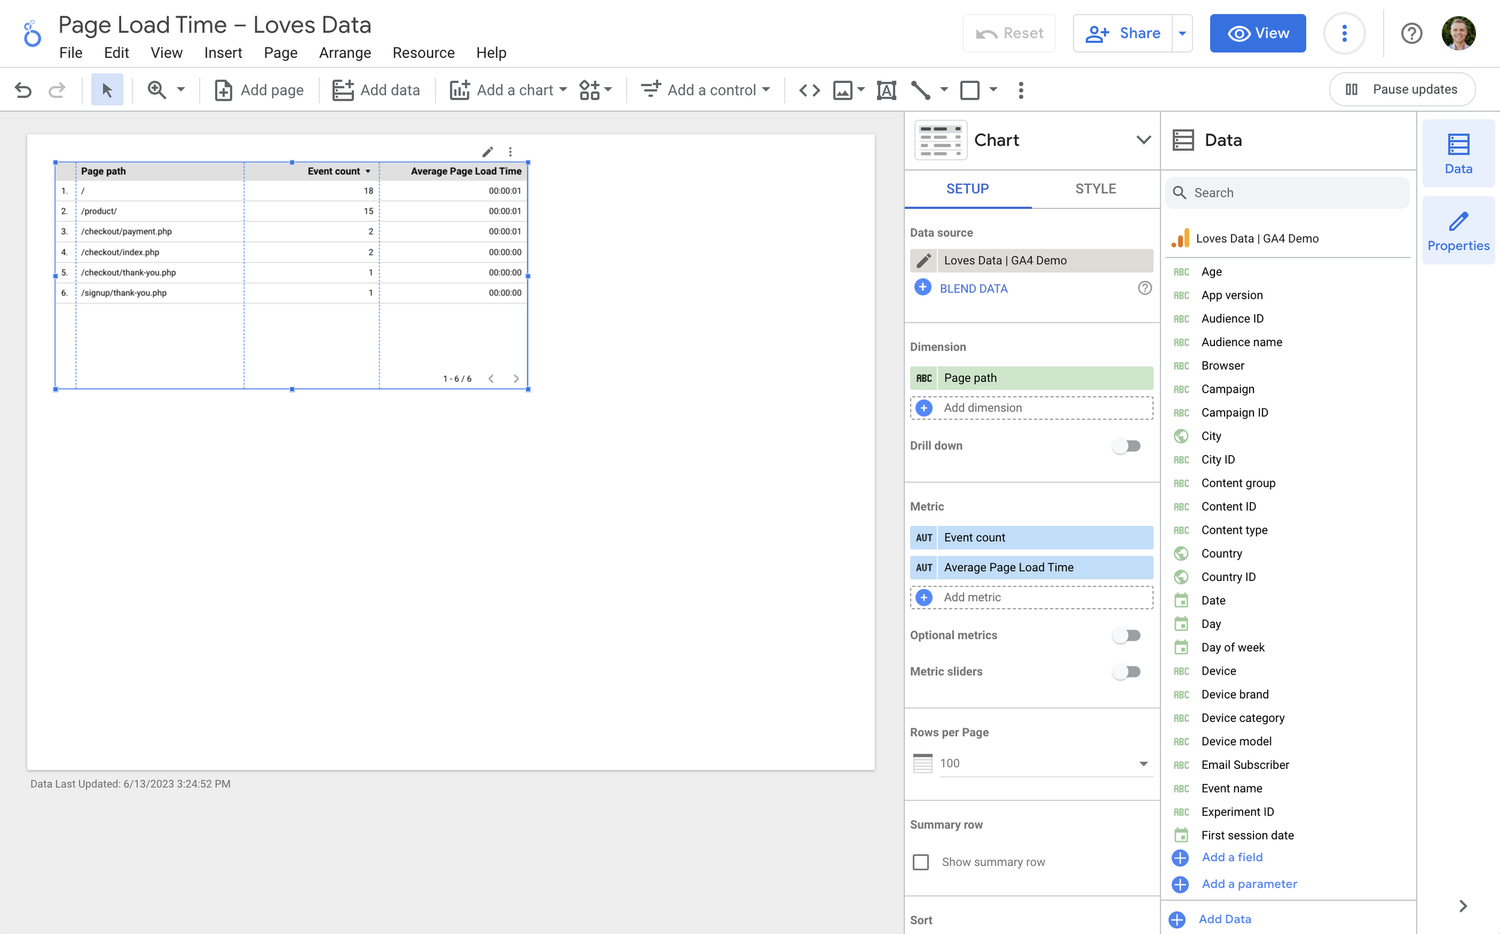
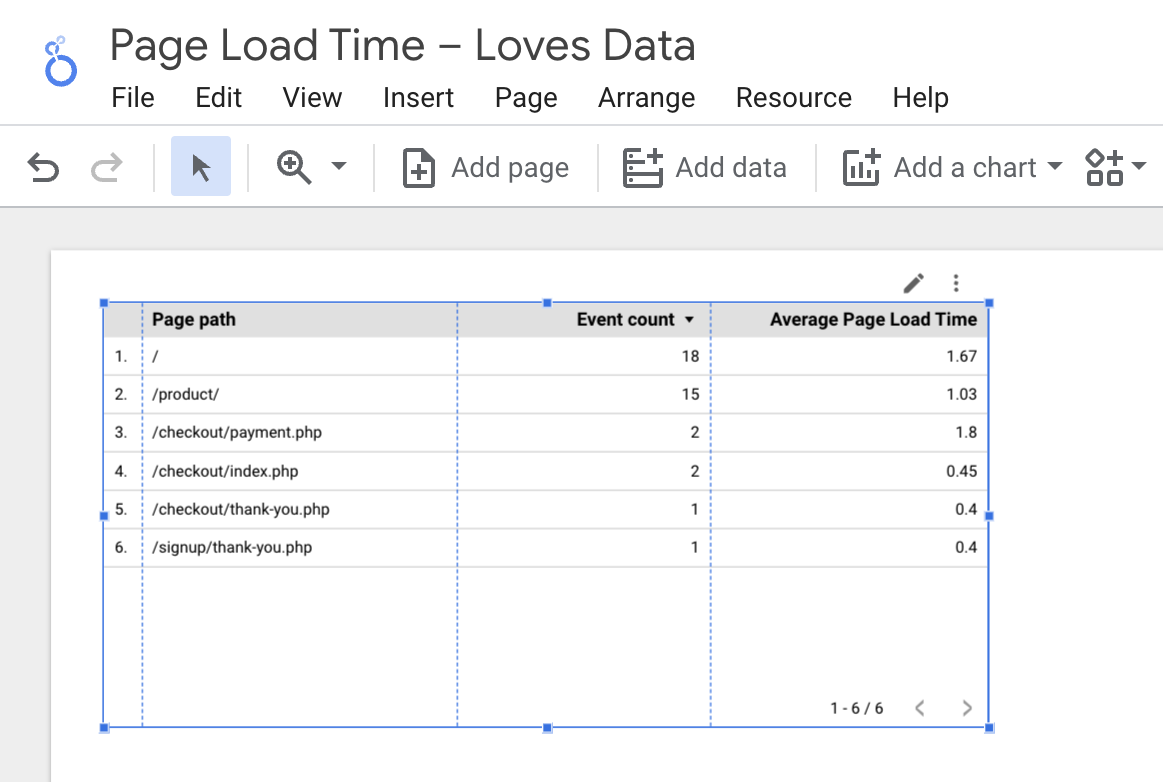
First, you will need to create a report and connect your GA4 property to Looker Studio. Next, create a table and add your preferred page-based dimension. I’ve used ‘Page Path’, but again, you could use one of the other options. I suggest adding ‘Event Count’ and ‘Average Page Loading Time’ for the metrics.
Since we previously created our custom ‘Page Load Time’ metric in Google Analytics, Looker Studio automatically provides us with the following fields to use in our reports:
- Page Load Time which will provide the total combined loading time for your pages, just like we saw directly in Google Analytics
- Average Page Load Time calculates the average loading time based on the custom metric we registered in Google Analytics
- Count Page Load Time provides the total number of times the loading_time_sec parameter was collected
Tip: You will see two metrics in Looker Studio named 'Average Page Load Time'. This is because Looker Studio automatically creates a metric to sow the average for our custom 'Page Load Time' metric.
Finally, we need to add a filter to our chart because there might be cases where a page view has been collected without our page load time tag firing. For example, if you decided to adjust the trigger so the event doesn’t fire on every page, if there was an error, or if the page loading time was calculated as zero seconds (or less).
Here’s the filter you can create and apply to your chart in Looker Studio:
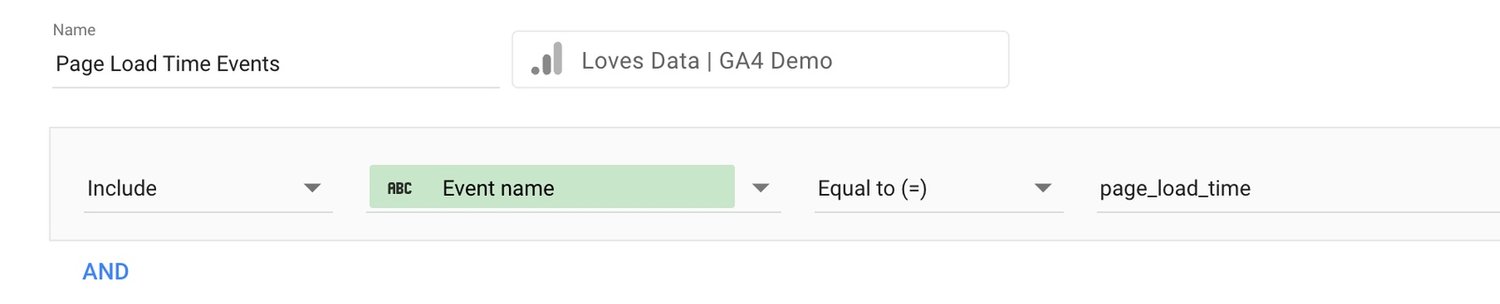
This will then give us a table that shows the average loading times for the pages on our website. You will find that Looker Studio automatically displays the loading time metric in the hours, minutes, and seconds format. If you prefer to see this reported as a number, you can click the edit icon (the small pencil icon) next to the metric and then change the ‘Type’ from ‘Duration’ to ‘Number’. This can be easier to read and interpret.
You’re now tracking and reporting page loading time in Google Analytics and Looker Studio using Google Tag Manager. When you’re ready, you can learn more about Google Analytics and Google Tag Manager in our GA4 Course and GTM Course.
FAQs About Page Load Time in GA4
How do I track page load time in GA4 (Google Analytics 4)?
GA4 doesn’t automatically provide page load time metrics. If you want to track how long your pages take to load, you’ll need to implement custom tracking.
You can do this by using your website’s performance data – for example, using the browser’s performance API – and sending a custom event into GA4. This lets you report on page load times directly inside GA4. If you apply the steps covered in the post, you will be able to report on the load times of your pages.
What is the average time on page in GA4?
GA4 focuses on 'Average Engagement Time per User.' This tells you how long your website was actively in view – meaning the user had your site open and wasn’t on another tab or screen.
You can find this metric in the 'Pages and Screens' report under 'Engagement.' It’s a good indicator of user attention, but it won’t show the total time someone spent on the page if they left the tab open in the background.
How to track time on page in GA4?
GA4 doesn’t provide a built-in 'Time on Page' metric. Instead, you can look at 'Average Engagement Time,' which measures when your page is actively being viewed.
How long does it take for GA4 to start working?
After adding the GA4 tag to your site, you should see data appear in the 'Real-time' report within a few minutes.
For other reports – like 'Engagement' and 'Events' – data processing can take up to 24 to 48 hours before it appears in the standard reports.
If you don’t see data, it’s a good idea to check your setup using the 'DebugView' in GA4 or use Google Tag Assistant to verify your tag is firing correctly.
How can I see slow pages in GA4?
Since GA4 doesn't provide page speed reports by default, you'll need to implement custom tracking to measure load times for each page (as we've covered in this post).
Once you've set this up, you can use an exploration report to find pages with higher average load times, helping you identify pages that might need speed optimizations.
For more detailed speed insights, you can also use tools like Google PageSpeed Insights alongside your GA4 data.
What’s a good page load time for SEO?
Google recommends aiming for a page load time of under 2.5 seconds for the largest content element (this is part of Core Web Vitals). Faster pages tend to provide a better user experience and can support your SEO performance.
While GA4 can help you see trends in load times if you implement custom tracking, it's also a good idea to monitor Core Web Vitals using tools like Google Search Console or PageSpeed Insights.
How do I debug page load time events in GA4?
Once you've set up your custom page load time event, you can use GA4’s 'DebugView' to confirm the event is being sent correctly.