
What is a good bounce rate in Google Analytics?
 Benjamin Mangold
Based on several Google Analytics benchmark studies, and my own experience working with client accounts, a typical bounce rate is around 40% to 50%.
However, it's important to highlight that this is a guide rather than a one-size-fits-all rule. Bounce rate can vary based on your industry, audience, traffic sources, and website. We'll explore this in more detail as we review and compare current benchmark studies.
It's also worth mentioning that in GA4 (Google Analytics 4), bounce rate is calculated differently from other analytics platforms, so we'll also cover how the metric is calculated and how to interpret the bounce rate you see in your reports.
What is Bounce Rate in Google Analytics?
In Google Analytics, bounce rate is the percentage of sessions that weren't considered engaged. A session will count as a bounce if it lasts 10 seconds or less, doesn't include a key event, and includes fewer than two page or screen views.
Bounce rate = (non-engaged sessions ÷ total sessions) x 100
This means your bounce rate is the opposite of your engagement rate. For example, if your bounce rate is 40%, your engagement rate will be 60%.
In many standard Google Analytics reports, you'll find engagement rate by default. This is the percentage of sessions that were considered engaged, which means the session lasted longer than 10 seconds, included a key event, or included two or more page or screen views.
While engagement rate is emphasized in reports, you can edit your reports or create an exploration to include the bounce rate metric.
Let's say somebody lands on one of your blog posts, reads it for two minutes, and then leaves without visiting another page. Google Analytics considers this an engaged session because it lasted longer than 10 seconds, so it won't count as a bounce.
This is different from the previous version of Google Analytics (Universal Analytics) and other analytics platforms, where a single-page session would typically be considered a bounce.
This difference is important when you're looking at benchmarks. Some bounce rate studies and reports use a single-page definition, which we can't compare directly to what we'll find in Google Analytics today.
What's a Typical Bounce Rate in Google Analytics?
There isn't an official Google benchmark for a good bounce rate, so I've compared several independent studies that specifically report GA4 data.
| Study | Dataset | Benchmark |
|---|---|---|
| Databox | GA4 benchmark data across multiple industries | 44.04% median bounce rate |
| AgencyAnalytics | More than 150,000 campaigns tracked by 7,000+ agencies | 45.9% median bounce rate |
| Siege Media | 546 GA4 properties and more than 16 billion sessions | 49.0% equivalent median bounce rate |
| Combined median | Median across the three studies | 45.9% |
| Simple average | Average across the three studies | 46.3% |
Across these three studies, bounce rate ranges from approximately 44% to 49%, with a combined median of 45.9%. The simple average is similar at 46.3%.
This supports using a bounce rate of around 40% to 50% as a general reference point for your Google Analytics reports.
Remember that these studies use different websites, industries, time periods, and samples. Bounce rate can also vary significantly depending on your traffic source, the devices people use, and the pages on your website.
For example, AgencyAnalytics found a median bounce rate of 43.85% for travel websites in its August 2025 data, while advertising and marketing websites had a median of 61.43%.
This is why it's more useful to compare your website with similar websites and traffic than to decide that one bounce rate is universally good or bad.
Bounce Rate Benchmarks by Industry
Industry benchmarks can give you more context than an overall benchmark, but the categories used by different studies don't always match up.
I've combined the closest comparable categories from Databox, AgencyAnalytics, and Siege Media below. Where three comparable studies are available, the combined benchmark is the median. Where only two are available, I've used the midpoint between them.
| Industry | Databox | AgencyAnalytics | Siege Media | Combined Benchmark |
|---|---|---|---|---|
| Ecommerce / Retail | 38.61% | 45.35% | 45.6% | 45.35% |
| Health / Wellness | 39.41% | 53.01% | 48.4% | 48.4% |
| SaaS / B2B* | 48.27% | 60.26% | 53.4% | – |
| Finance | – | 58.59% | 49.0% | 53.8% |
| Home Services | – | 54.37% | 50.6% | 52.5% |
| Travel | 38.84% | 43.85% | – | 41.3% |
| Real Estate | 42.14% | 50.79% | – | 46.5% |
| Education | 46.28% | 52.80% | – | 49.5% |
| Automotive | 40.10% | 57.99% | – | 49.0% |
*AgencyAnalytics uses the broader category 'Business Services', while Databox and Siege Media use categories closer to SaaS and B2B software. I've included the AgencyAnalytics figure for context, but haven't calculated a combined benchmark for this category.
Looking across the studies, there are some clear differences between industries. Ecommerce and retail tend to have lower bounce rates, while SaaS, B2B, and some service industries tend to be higher.
The differences between the studies are also useful. For example, health and wellness ranges from 39.41% in Databox to 53.01% in AgencyAnalytics. This doesn't necessarily mean one study is more accurate than another. The websites, time periods, sample sizes, and industry definitions are different.
For this reason, I recommend treating the combined benchmarks as a general guide and reference point rather than a precise measure.
Device and Traffic Source Matter Too
Your overall bounce rate can also be affected by the devices people use and where your traffic comes from.
For example, Siege Media's GA4 benchmark study found a median engagement rate of 55.3% for desktop traffic compared with 48.8% for mobile traffic. This is equivalent to bounce rates of 44.7% for desktop and 51.2% for mobile.
This means a website with a high proportion of mobile traffic might naturally have a different overall bounce rate from a website that receives mostly desktop traffic.
Traffic sources can have an impact too. Search traffic generally has clearer intent because somebody is actively looking for something before they arrive. Other channels, such as display or paid social advertising, can generate interest without the same intent, so you can see higher bounce rates.
So I suggest breaking down bounce rate by device and traffic source instead of relying on a top-level percentage.
How to Interpret Your Bounce Rate
Instead of asking whether your entire website has a good bounce rate, I recommend using bounce rate to identify differences and changes in your data.
1. Compare similar landing pages
Start with the pages people land on when they visit your website. If a group of similar landing pages normally has a bounce rate around 40% and one important page has a bounce rate of 65%, this gives you something to investigate. Check whether the page matches what visitors expected before arriving and whether there are any usability, content, or technical issues getting in the way.
2. Compare traffic sources
Next, compare your acquisition channels. For example, somebody clicking an organic search result might behave differently from somebody who clicks an ad while scrolling through social media.
A high bounce rate from one channel isn't necessarily a problem if that type of traffic normally behaves differently. The more useful comparison is often how that channel performs over time or against similar campaigns.
3. Compare devices
It's also worth comparing desktop and mobile traffic. If mobile has a substantially higher bounce rate than desktop, check your mobile experience. Slow loading times, difficult navigation, forms that are hard to complete, or layout issues can cause people to leave.
4. Look for changes over time
Your historical data might be more useful than an industry benchmark. For example, if a landing page normally has a bounce rate of 42% and this suddenly increases to 60%, it's worth investigating. The change could be caused by an update to the page, a new traffic source, a campaign change, a technical problem, or a tracking issue.
5. Consider the purpose of the page
Finally, consider what you expect somebody to do on the page. For example, somebody might land on a contact page, find your phone number, and call your business. If the phone call isn't measured, the session could potentially be classified as a bounce even though the page achieved its goal.
Bounce rate is most useful when you interpret it alongside the actions people are actually taking.
How to View Bounce Rate in Google Analytics
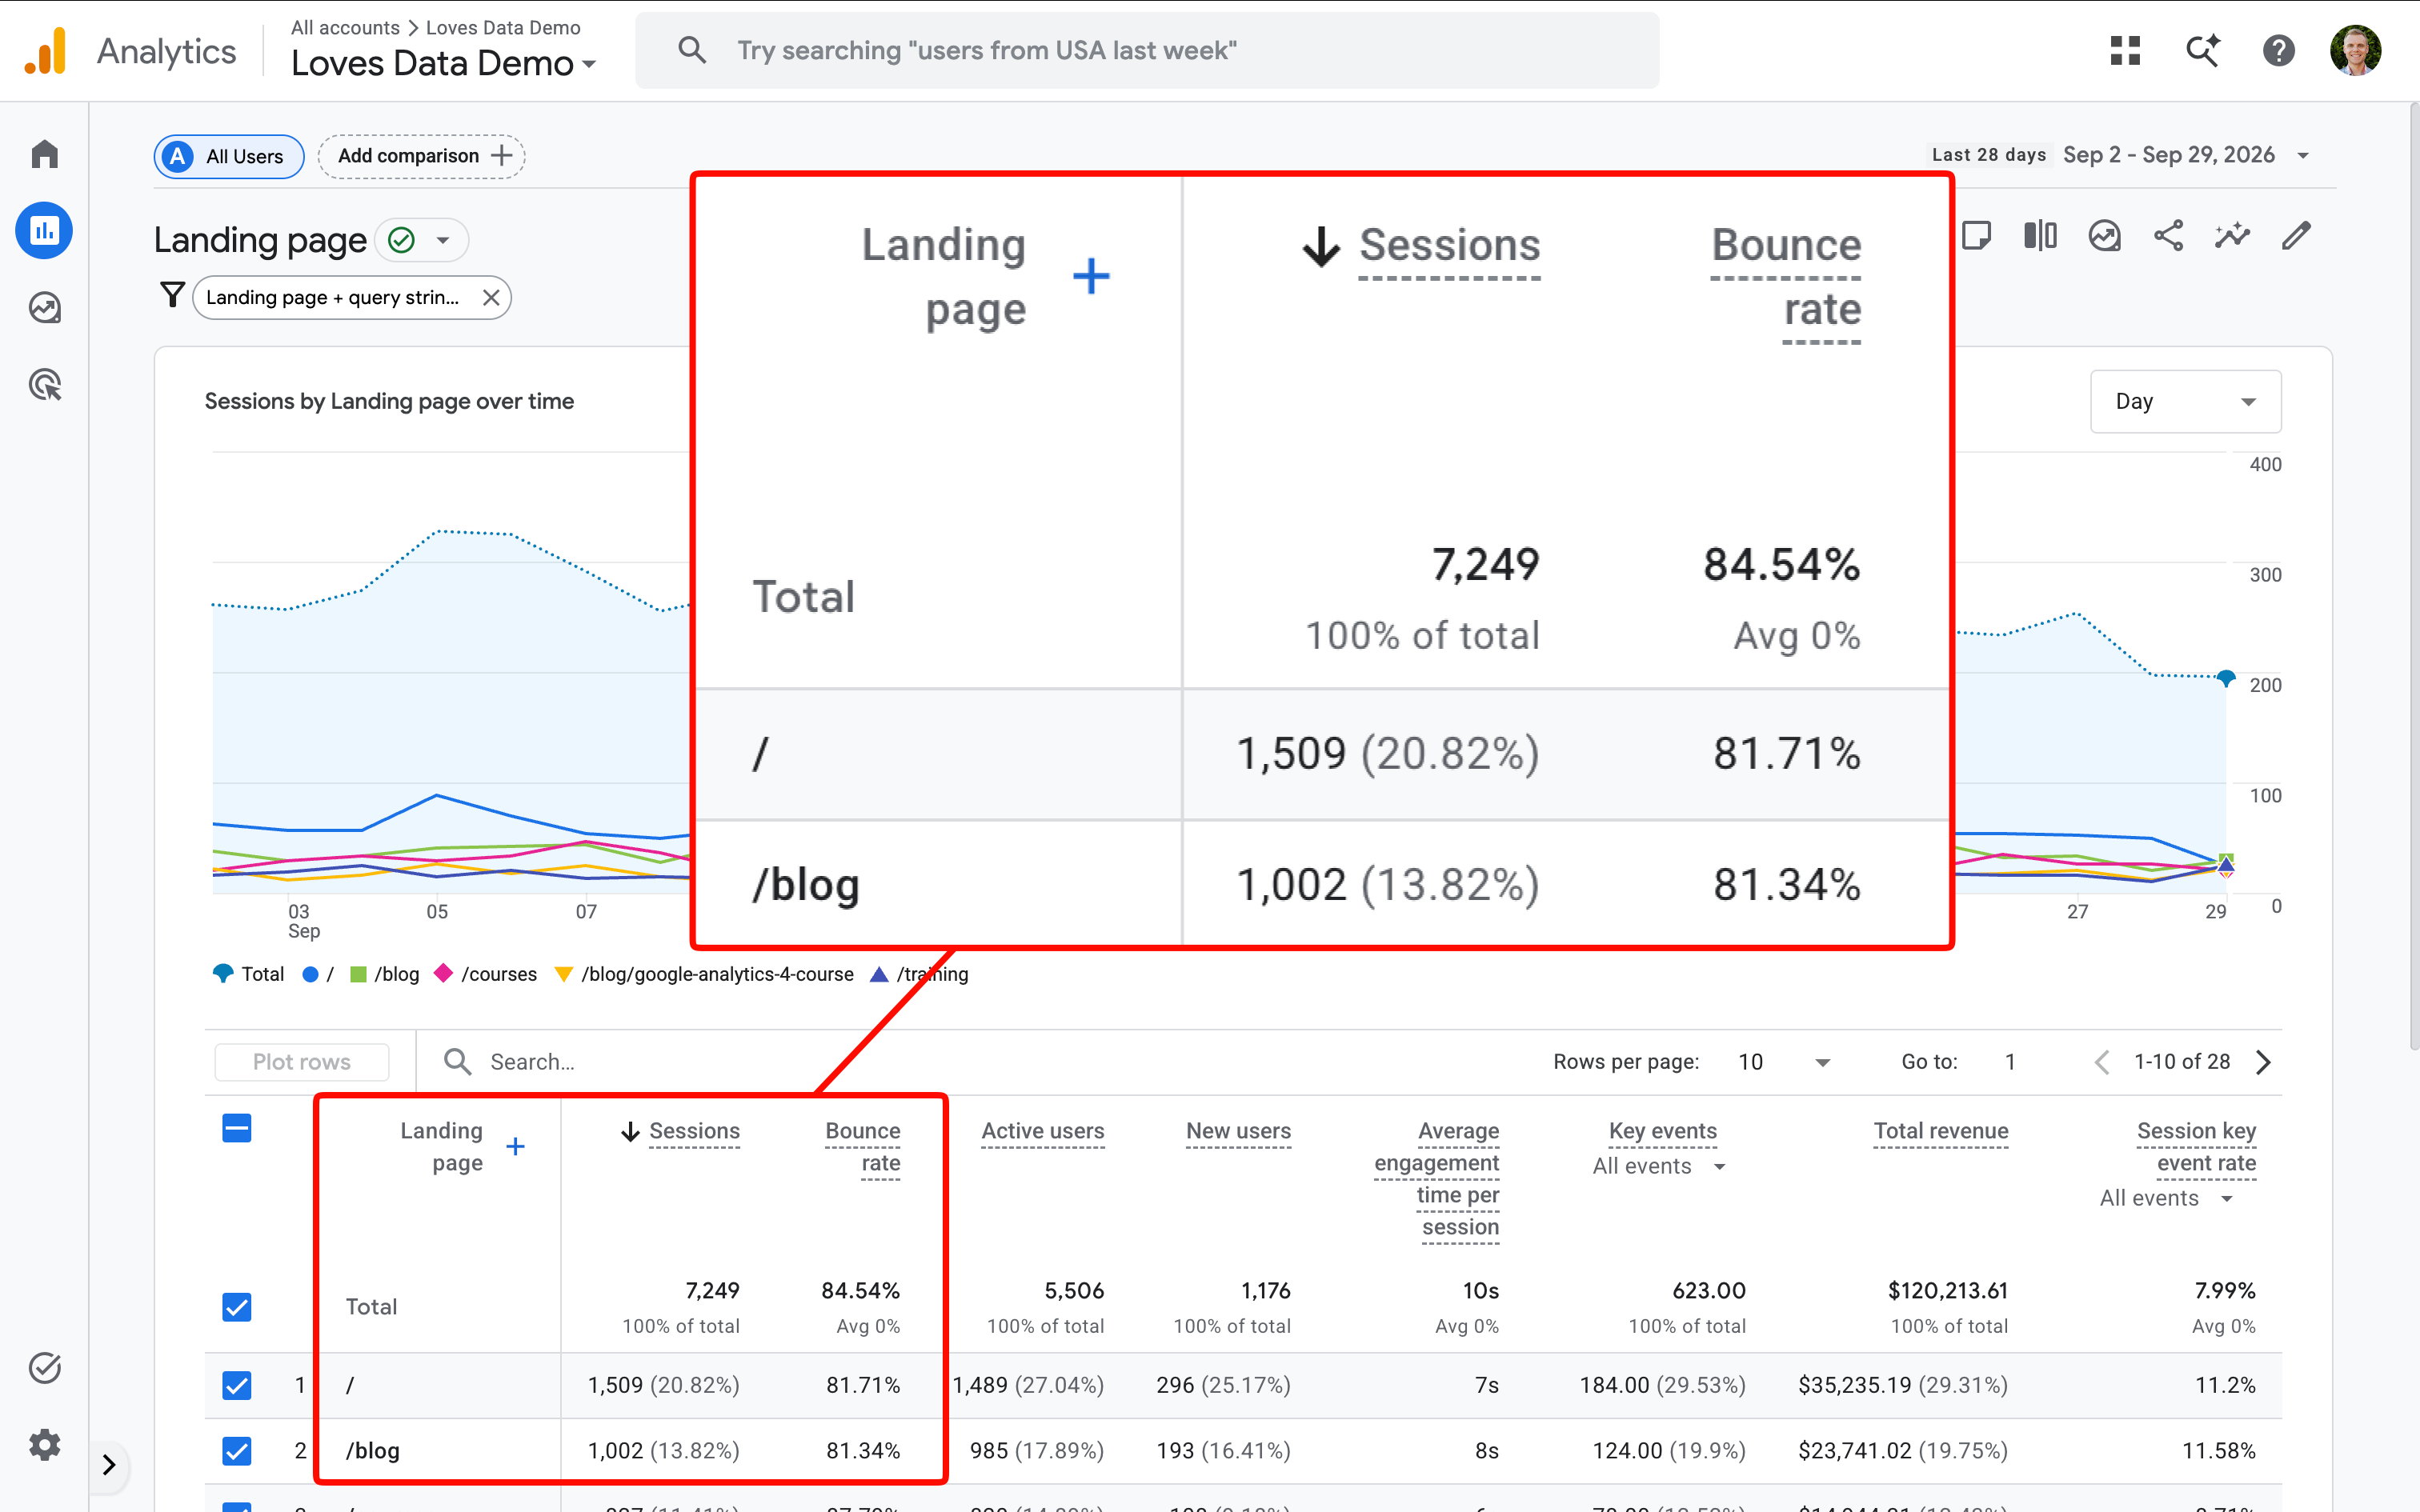
Bounce rate isn't included in most standard Google Analytics reports by default, but you can edit a detail report to add it. For example, you can add bounce rate to your landing page report to compare engagement.
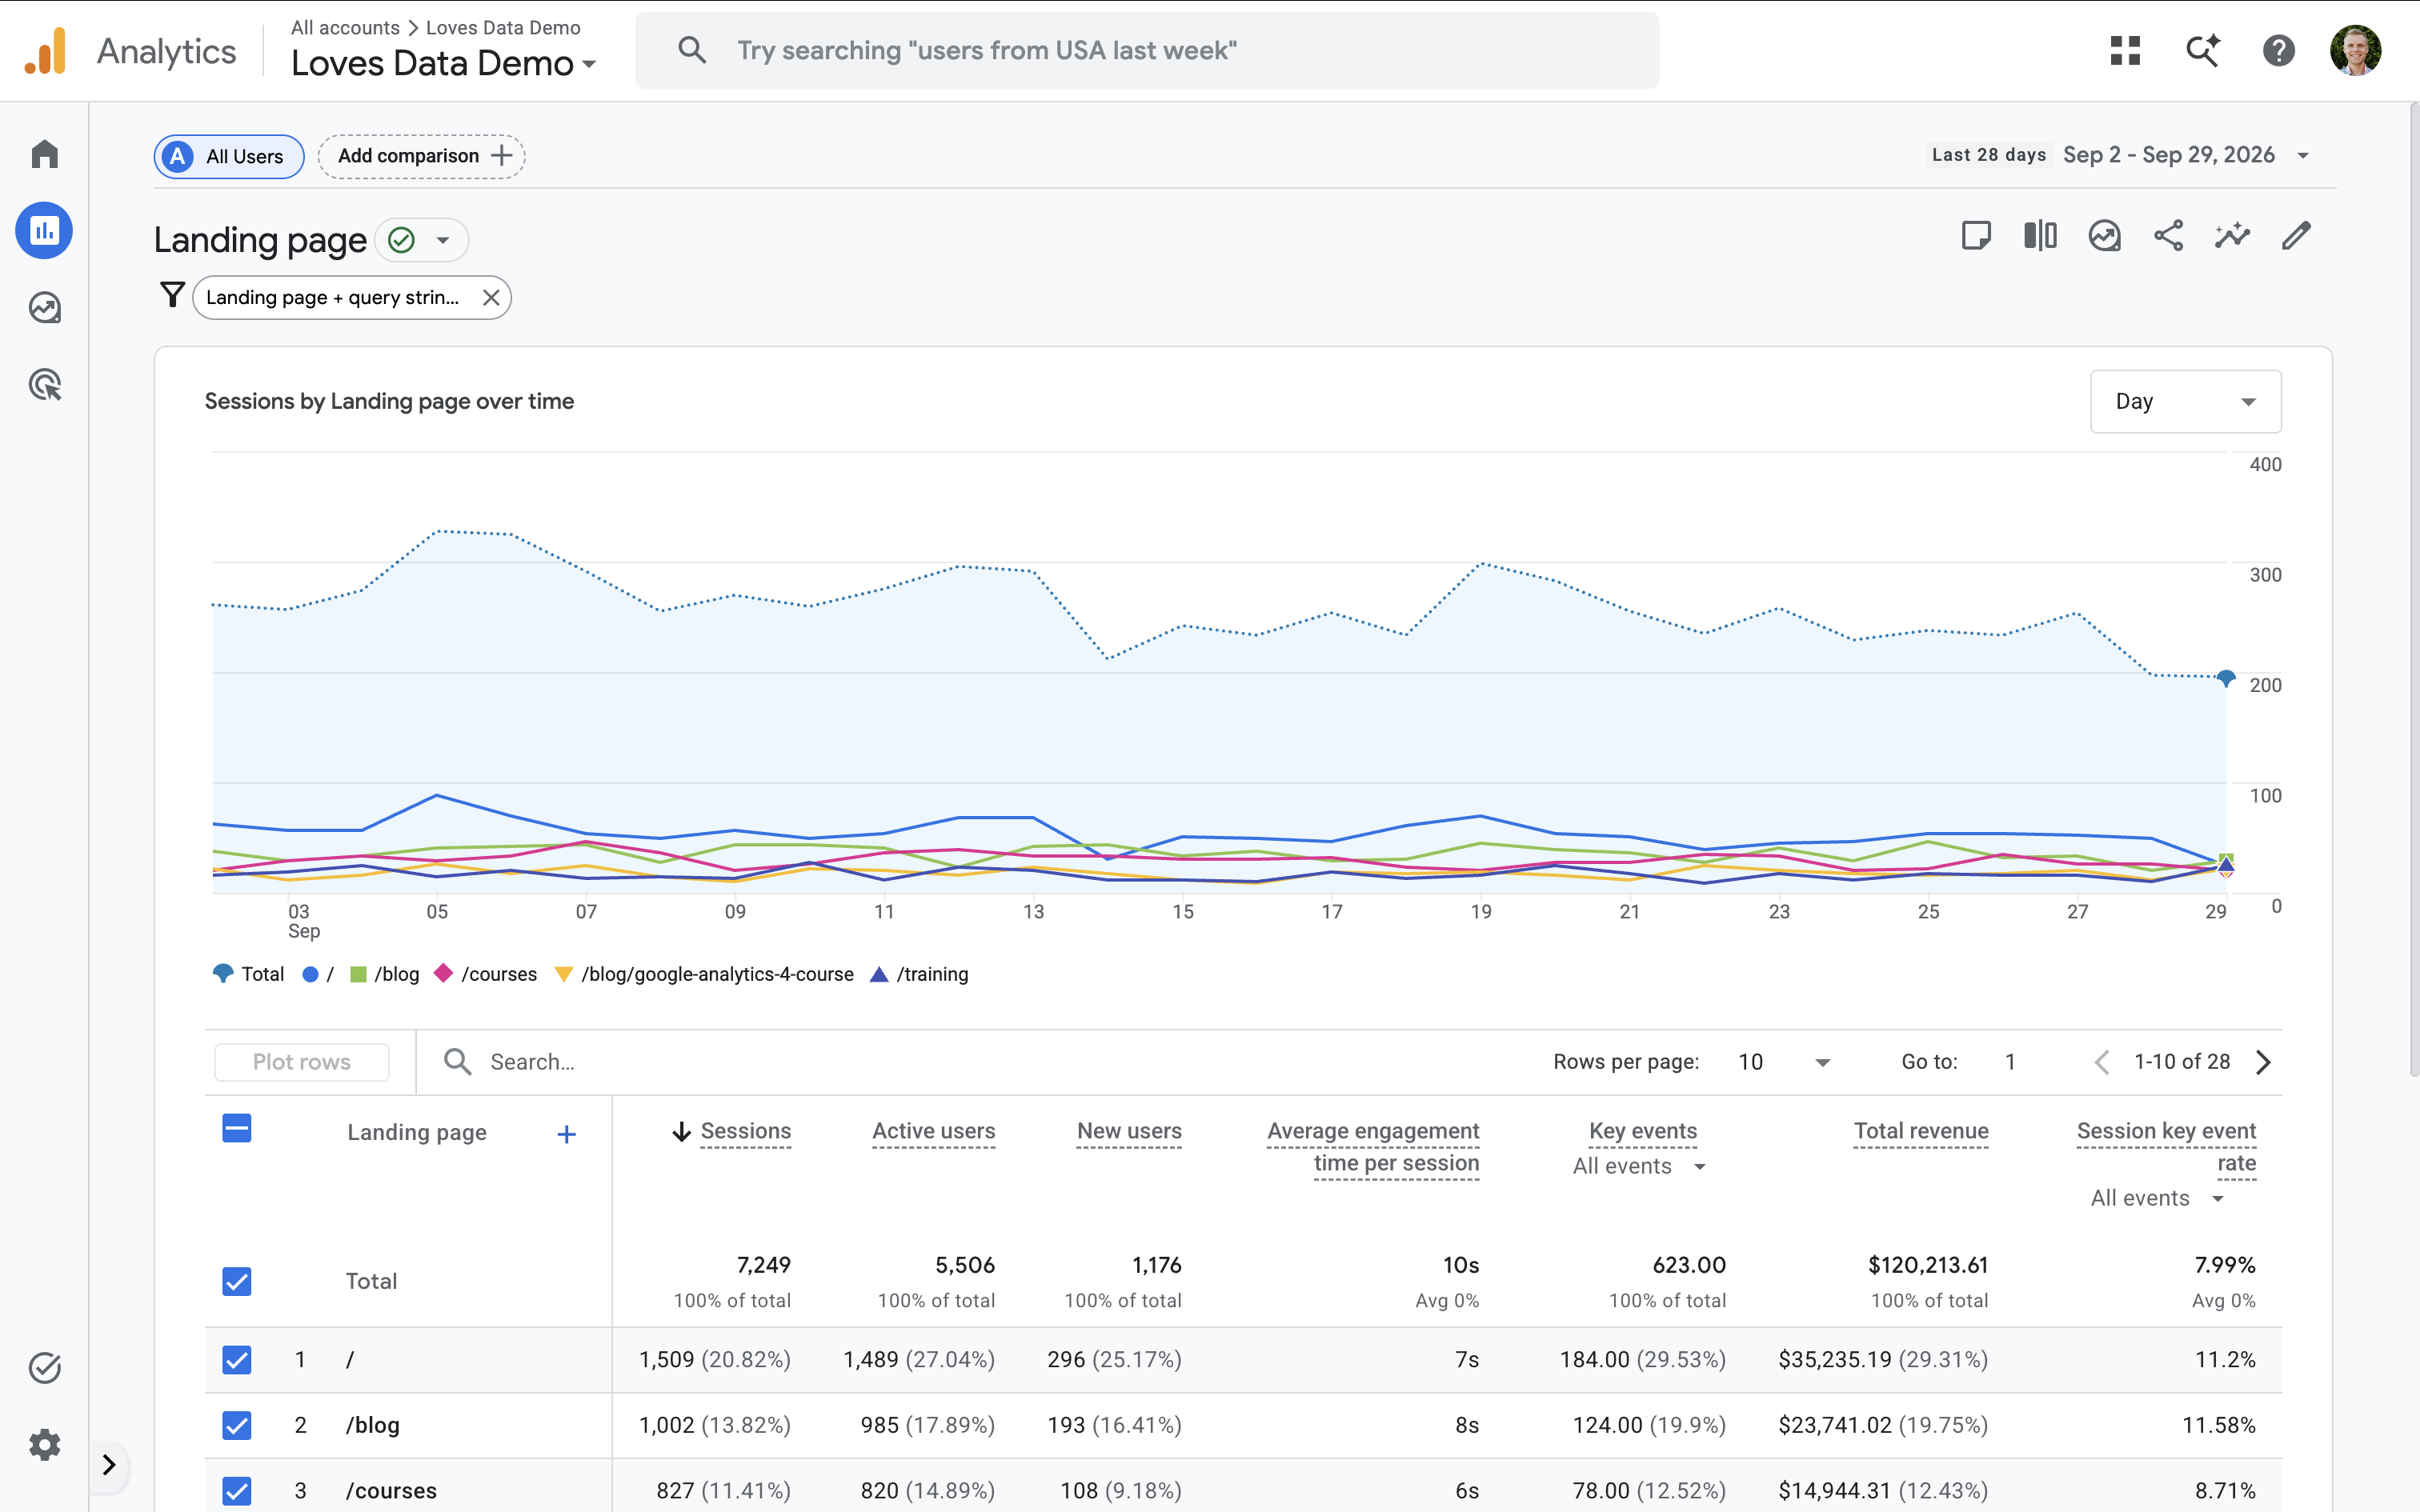
You will need Editor or Administrator permission to customize a standard report. You can then follow these steps:
- Navigate to 'Reports' in Google Analytics.
- Open the detail report you want to customize, such as the 'Landing page' report.
- Select the 'Customize report' icon in the top-right corner.
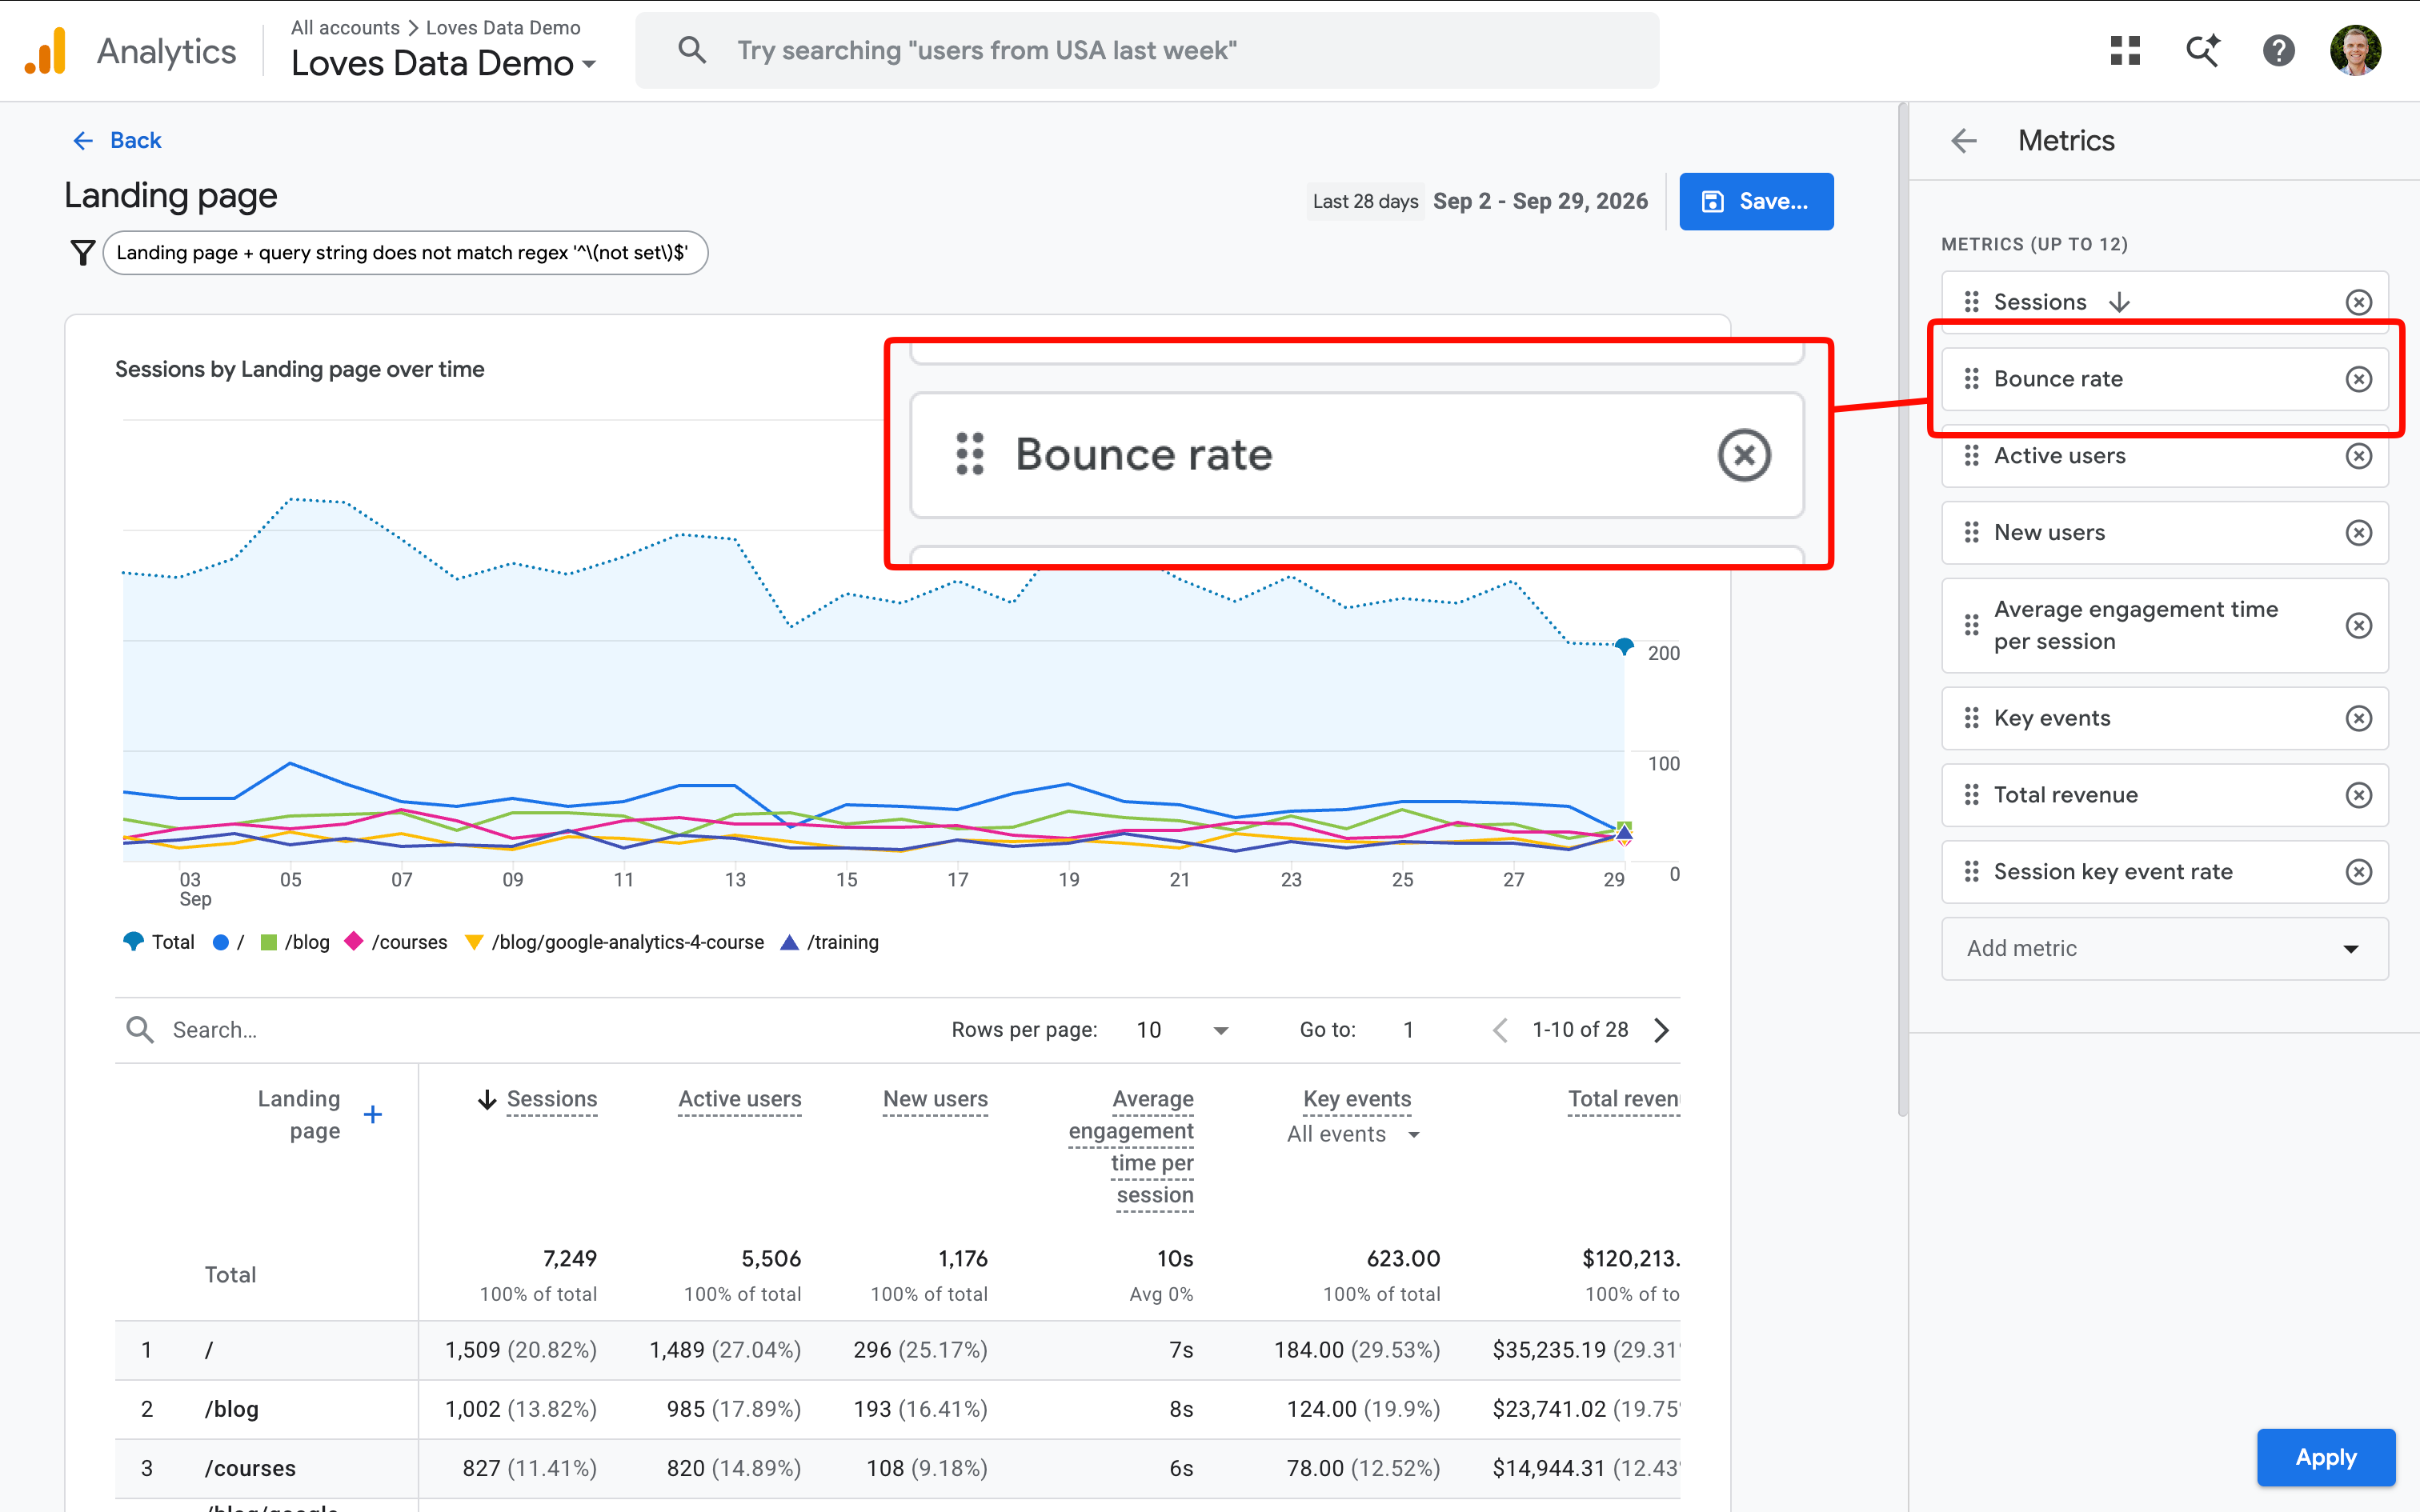
- Under 'Report data', select 'Metrics'.
- Select 'Add metric'.
- Search for and select 'Bounce rate'.
- Select 'Apply'.
- Select 'Save', and then select 'Save changes to current report'.
Bounce rate will now appear as a metric in the report. Depending on the number of metrics included, you might need to scroll horizontally to see the new column.
Tip: If you don't see the 'Customize report' icon, check your permissions. You might not have Editor or Administrator access for the property.
View Bounce Rate in an Exploration
You can add the bounce rate metric to an exploration without changing any of the standard reports.
To do this, navigate to 'Explore' and create a free-form exploration. You can then add 'Bounce rate' as a metric and combine it with dimensions such as landing page, device category, session source, session medium, or session default channel group.
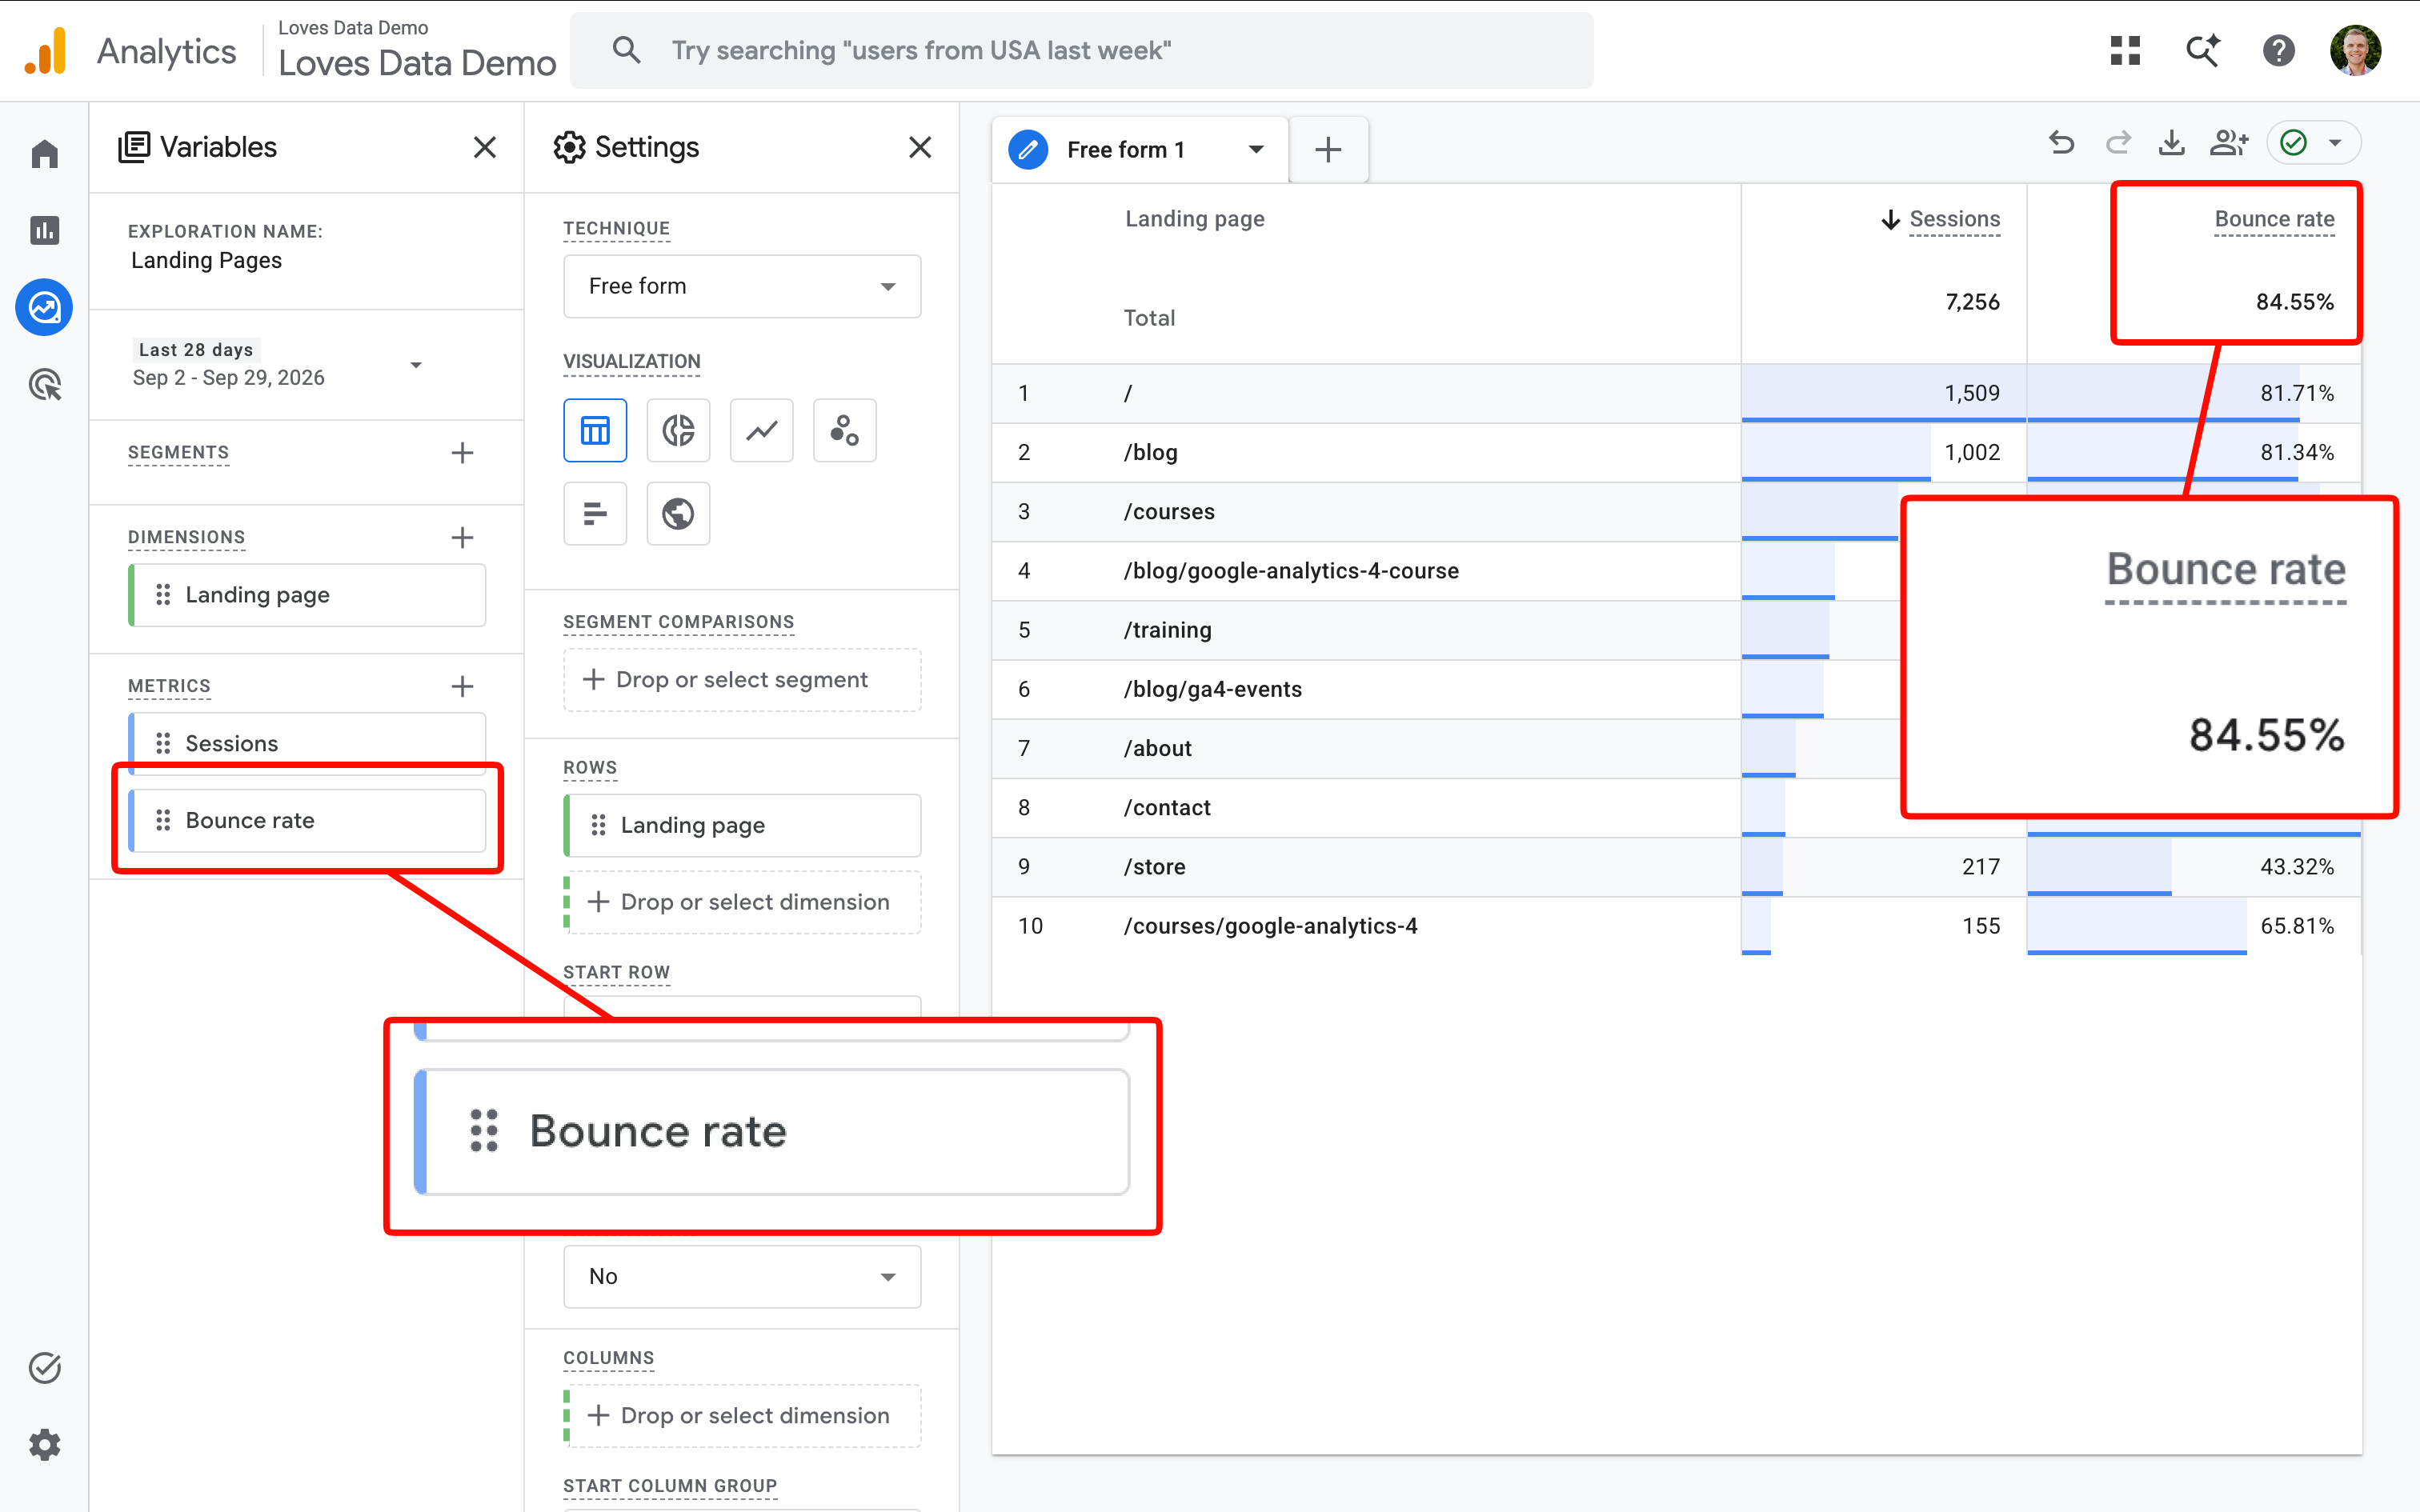
This can be particularly useful when you're investigating why one group of sessions has a higher bounce rate than another.
What to do if Your Bounce Rate is High
If you've identified a page or traffic segment with a higher than expected bounce rate, start by trying to understand why people aren't engaging.
Check that the page matches what people were expecting before they arrived. The content on a landing page should align with the ad, search result, email, social post, or other link that brought people there. Next, review the experience on the page.
Depending on what you find, you might need to:
- Improve page speed.
- Fix mobile usability issues.
- Make navigation clearer.
- Improve the relevance of the content.
- Make important calls to action easier to find.
- Add useful internal links where they help visitors continue their journey.
- Remove unnecessary or distracting elements.
It's also worth checking your Google Analytics implementation. If an important action isn't being measured correctly, or an event that matters to your business isn't configured as a key event, successful visits might not be reflected in your engagement metrics.
Use Bounce Rate as a Benchmark, Not a Target
Looking across the GA4 benchmark studies we've reviewed, the combined median bounce rate is 45.9%. Along with my own experience, I think an overall bounce rate of around 40% to 50% is a useful reference point, but there isn't one bounce rate you should aim for.
Your industry, traffic sources, device mix, landing pages, and what you're asking visitors to do can all influence your bounce rate. Use external benchmarks to add context, then compare similar parts of your own website and monitor how they change over time.